The easiest thing to do when comparing platforms is to line up their APR figures and see whose is biggest. That is also the least useful step you can take — that number was written by the party selling to you, and you hold nothing that can verify it.
What actually separates them is a different set of four questions. None of them asks how much you will make. All four ask what structure the money sits in.
1. Whose account holds the money
This is the first question, and the only one that changes the nature of the risk. Two shapes are common.
The money stays in your own exchange account and the platform holds nothing but an API key to trade with. Under this shape the platform cannot touch your principal — the price is that it also cannot promise anything about the return, because it has no lever with which to perform on your account.
The money is placed with the platform’s dedicated account and the platform runs the strategy. Only under this shape can a floor or a principal guarantee mean anything, but what you take on is platform credit risk: the money sits in someone else’s account, and performance rests on their ability to pay.
All three of our plans are the second shape, for exactly the reason in the previous sentence: a floor and a principal guarantee have to be performed by the platform, and with the money elsewhere they are words. That price has to be stated with the same weight: custody is not principal protection, and transparency does not cancel credit risk.
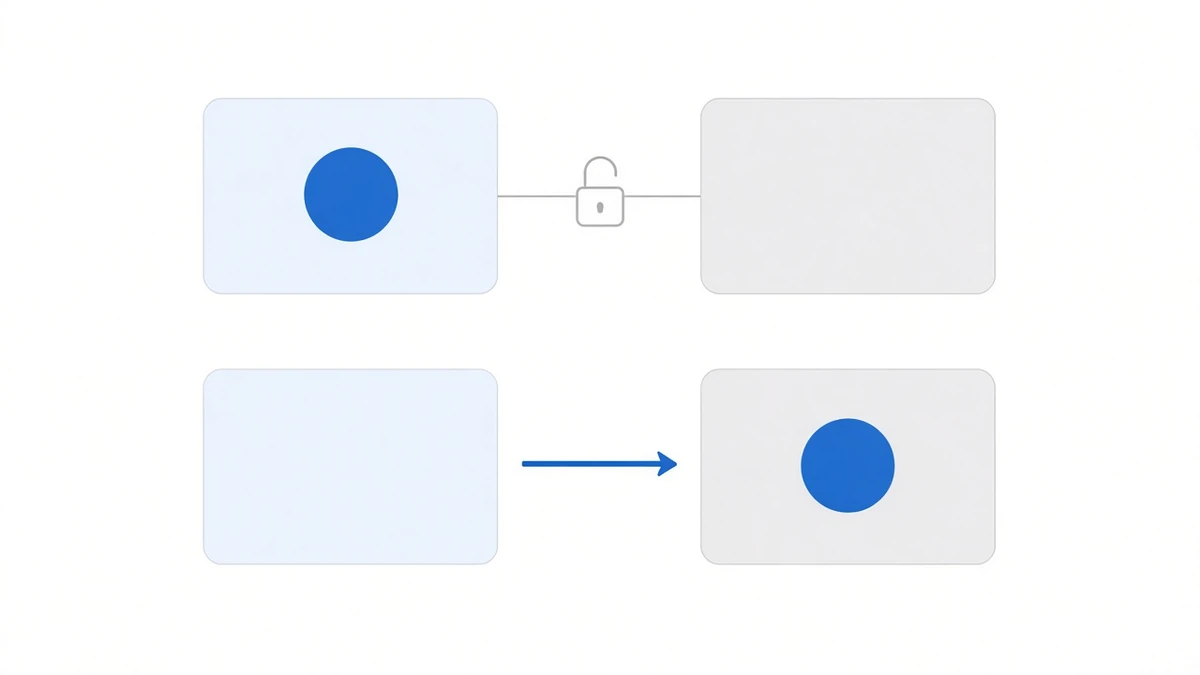
What to ask: whose name is the account in? If it is custodial, who performs, and with what?
2. Where the fee comes out of, and what happens in a thin year
This matters more than whether the rate is high or low. The same “2%” taken out of principal and taken out of return are two different things.
Our three plans share one 2% annual management fee, charged out of the return, never billed to the investor separately. In a year where the return does not cover it, the platform collects less; it does not come back to the investor for the difference.
The split should also be something they can write down. Ours is:
distributable excess = gross return − management fee − floor
what you take home   = floor + your share of the excess
The only difference between the three plans is how much protection you want against how much of the excess you give up:
| Plan | 100% principal guarantee | Floor APR | Excess split (platform : you) |
|---|---|---|---|
| Capital and yield protected | yes | 7% (take-home) | 100 : 0 |
| Capital protected, 7:3 | yes | none | 70 : 30 |
| No capital guarantee, 3:7 | no | none | 30 : 70 |
Read down the three rows and it is a staircase: the more excess you give up, the stronger the protection you get back. A table where one plan offers both the strongest protection and the largest share is arguing with itself.

3. What the worst year looked like
An average with no year-by-year table behind it leaves you guessing where the bad years went.
The ugliest cell in our table is ETHUSDT in 2022, 7.873% for the whole year (on the scaled-capital basis). In a bear market this strategy really does thin out like that — funding is set by market sentiment, it drifts toward zero in flat and falling markets, and in stretches it goes negative.
We put it on the page not to look candid but because a table with only good years reads as one where the bad years were removed, and then the good years stop being believed either.
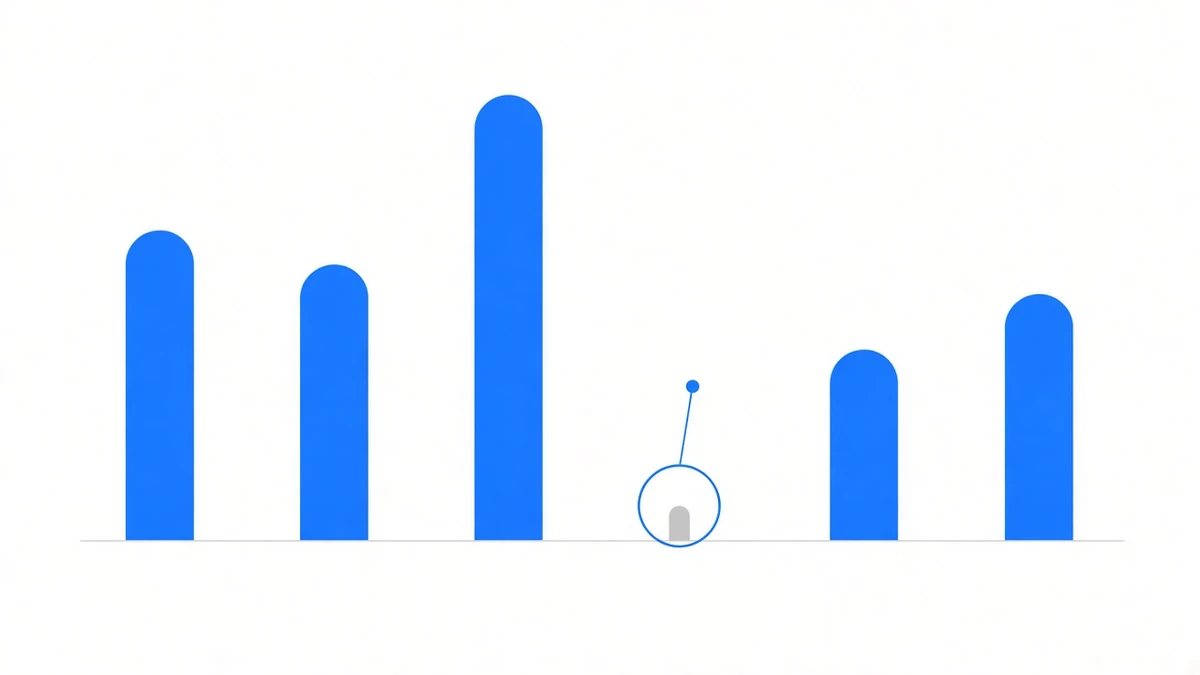
What to ask: which year was the worst, and by how much? Is it on the same table as the good ones, at the same size?
4. Which figures you can pull yourself
“There’s a dashboard” is not an answer. The question is which items in that dashboard your own credentials can retrieve.
On our side, what an investor can pull in real time is: balance, per-trade history, positions, the return curve, subscription records, and withdrawal status.
One item needs saying plainly: the solvency ratio is not on that list. It sits behind admin permissions and an investor cannot query it. Describing something unqueryable as queryable is worse than leaving it off.
Two that get skipped
Minimum and term. Ours starts at 5,000 USDT, with terms of one to five years depending on the tier. The longer the term, the more explicitly the exit has to be written down — a table that shouts lock-up in one row and withdraw-any-time in another has one false statement in it somewhere.
Whether the calculator compounds. Returns are paid out (annually, quarterly or monthly depending on the plan) rather than rolled back into principal, so the year-by-year arithmetic is strictly linear. If you see a compounding curve bending upward, ask what it assumed — at minimum it assumed you reinvested every distribution, and the terms usually say no such thing.
What the four have in common
Not one of them asks about the rate of return. They all ask about structure: where the money is, how the fee is taken, whether the bad years are on the page, which figures you can pull. With the structure clear, the return figure starts to mean something. With the structure unclear, the number could say anything.
Where the funding payment itself comes from is in what a funding rate is; what gets eaten during execution and never shows on the table is in six hidden costs; the year-by-year figures including the worst one are on the track record; how custody works and where the API permission boundary sits is in how it works and custody and verification. If you are still weighing up building it yourself, the line-by-line comparison of running it yourself against handing it over sets out the cost of both routes.