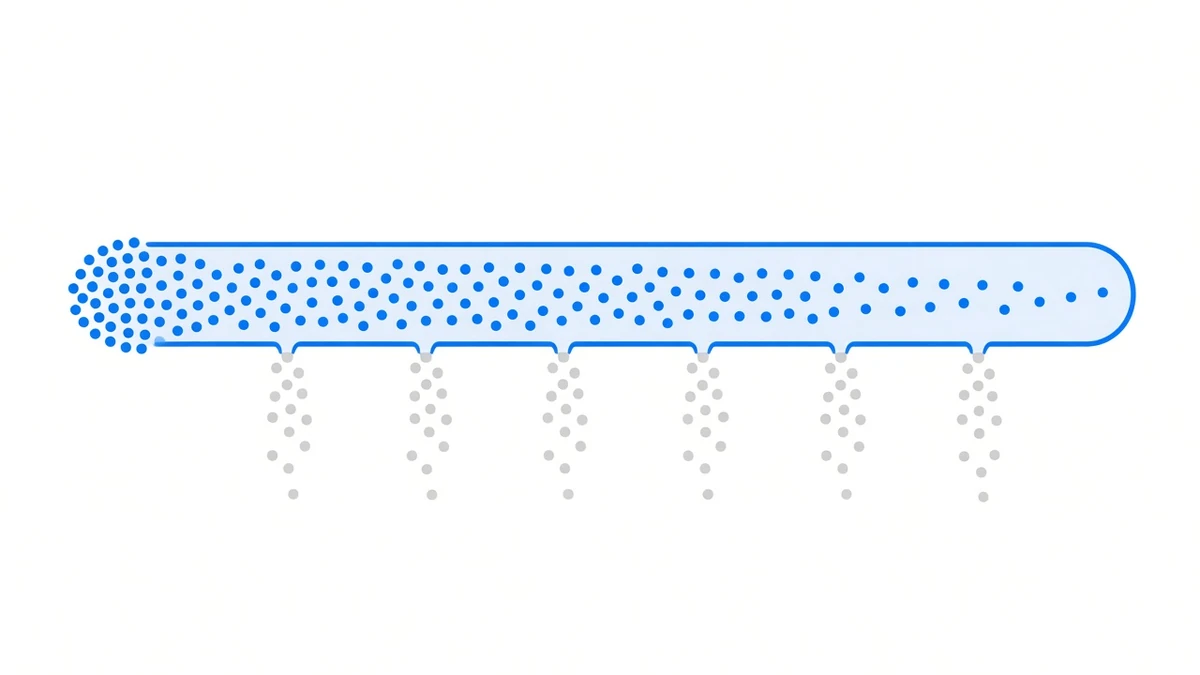
Funding rate arbitrage does not bet on direction. Once the two legs cancel out the price risk, the only income left on the book is the funding payment itself. What actually eats that income is a different set of six costs, and they share one property: none of them are visible on an exchange screen or a funding rate table.
The six below are in the order we hit them on our own accounts, each with the numbers we measured at the time.
1. Taking the wrong side: the leg that collects becomes the leg that pays
The sign of the funding rate decides which side you take — positive means short the perp and collect, negative means long the perp and collect. The problem is that the sign flips between settlements, while the direction on screen comes from a scanner snapshot that refreshes once a minute.
Open against a sign that has already flipped and both legs fill normally. The receipt says “opened”. Nothing in it hints that you are standing on the wrong side, and from then on every funding payment you expected to receive goes out instead. We measured one of these: a 100 U position, roughly −$18 the moment it opened.
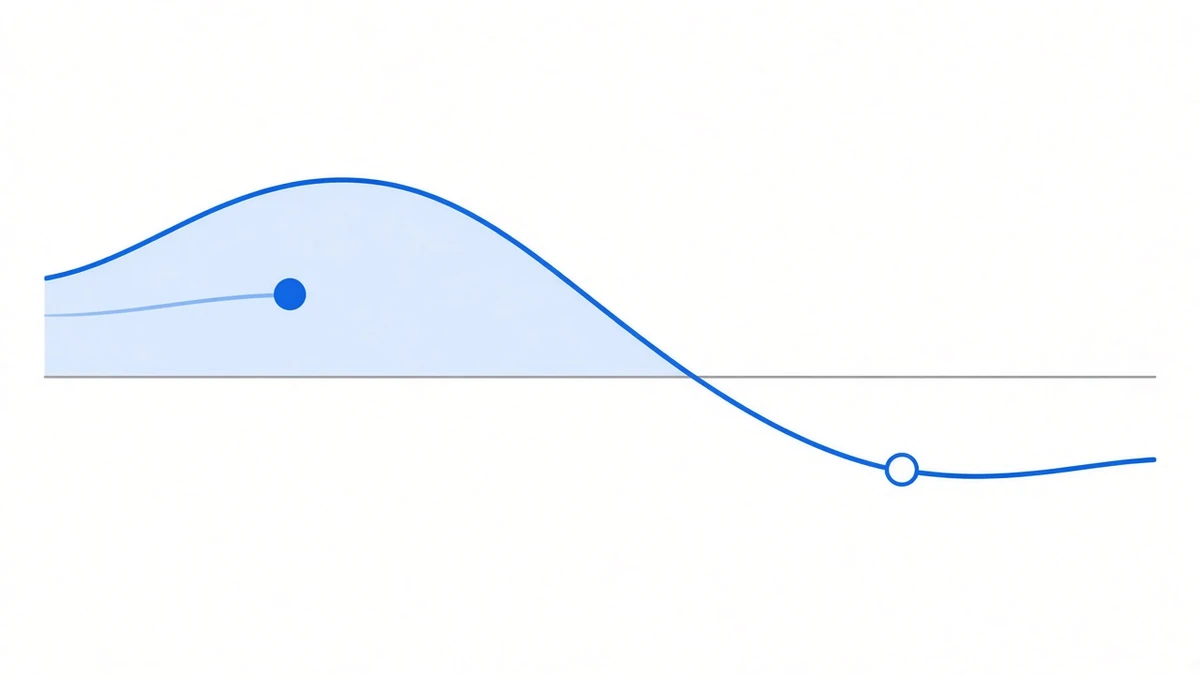
Refreshing faster does not fix this. We turned it into a hard gate instead: every order path re-reads the live funding table at the moment of submission and takes the direction from what comes back. If it cannot be read, the order does not go out. Skipping a trade costs one line in a log; taking the wrong side costs real money.
2. Spread: the half of the cost that is as expensive as fees
Opening and closing two legs is four orders, and all four are takers. So the cost has two halves with identical structure:
round-trip fees   = 2 × (perp taker rate + margin taker rate)
round-trip spread = 2 × (perp half-spread + margin half-spread)
round-trip cost   = fees + spread
The spread half is routinely dropped altogether, and it is not a rounding correction:
| Symbol | Round-trip fees | Round-trip spread | Spread share of cost |
|---|---|---|---|
| INJUSDT | 0.30% | 0.048% | ~14% |
| CHRUSDT | 0.30% | ~0.30% | ~50% |
CHRUSDT is expensive because its price carries only five significant figures — a single tick is 0.074%, and you cross it four times.
The ugliest row we found was HOLOUSDT: +0.002% net per period counting fees only, −0.09% once the spread goes in. On a fees-only basis it read as tradeable the whole time.
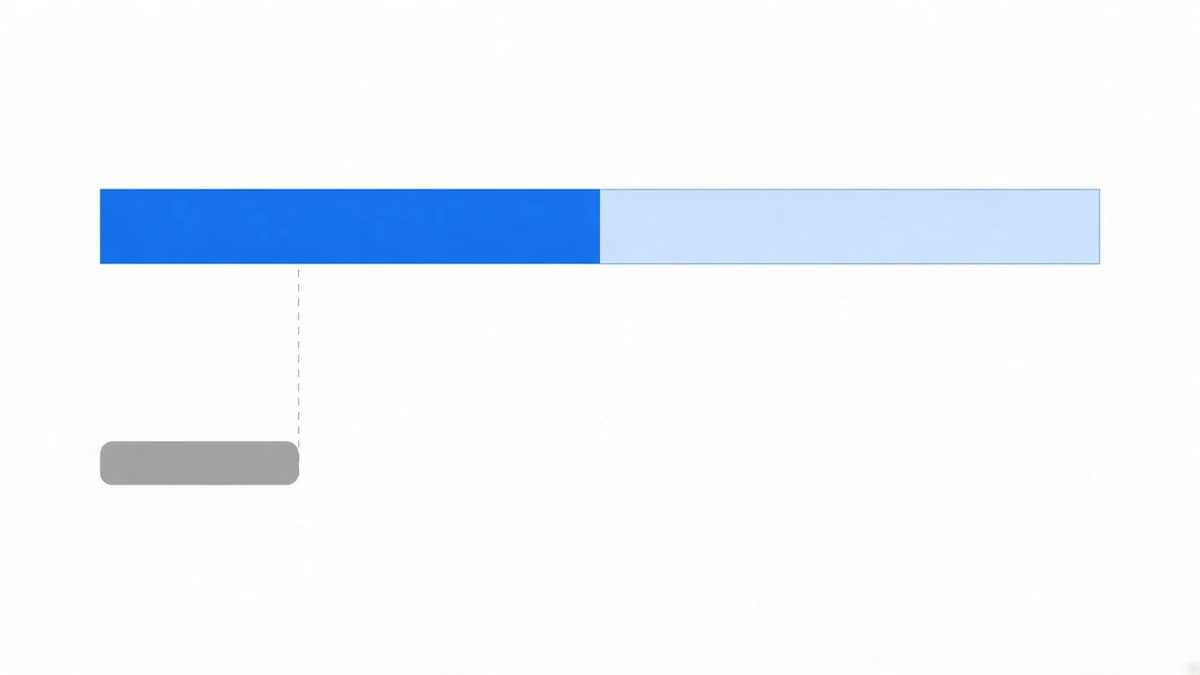
One mistake of our own belongs here: the two legs do not charge the same rate. Early on the code carried a single constant, “round trip = four orders × 0.05%”, applying the perp rate to the margin leg as well. The real figure is 2 × (0.05% + 0.1%) = 0.3% — a third short. Being a third short throws no error. It just shortens the break-even count and lets through a batch of rows that should have been rejected.
3. Break-even periods: the number the annualised yield hides
“40% annualised” is a hold-forever figure. The question that decides whether a row is tradeable is a different one:
break-even periods = ⌈round-trip cost ÷ yield per period⌉Four taker fills at 0.05% is 0.2%, while one period of funding is typically around 0.01% — a single period in and out cannot cover the cost, and a negative net is the normal case, not a red flag. Unpacked, that 40% row needs 20 periods, roughly 6.7 days, to break even. The rate often flips within two.
So the executable number on a scanner is the break-even count, not the annualised yield. Annualising exists to sort across symbols: 0.01% on a 4-hour contract and 0.01% on an 8-hour one are a factor of two apart over a year.
4. Borrow-and-sell: interest on the full notional, not on a borrow ratio
To collect on the negative side, the spot leg has to be net short. Those coins come from exactly two places — ones you already hold, or ones you borrow. There is no third. (“Buy them, then sell them” is not one: buy X and sell X and the spot leg nets to zero, leaving a naked long plus two wasted fills.)
If you borrow them, the interest works nothing like leveraged buying:
leveraged spot buy : borrow ratio = 1 − 1/leverage   ← only the part your own capital does not cover
borrow and sell    : borrow ratio = 1                ← every coin you sold was borrowed
Carrying the first formula over understates the interest — at 2× leverage, by exactly half. Here is a row sitting right on the line: 4-hour settlement at −0.01%, 21.9% annualised, which reads fine. But if the base asset’s daily borrow rate is above 0.06%, that row is net negative, and it still appears on the table as a negative funding opportunity.
The rate is not fixed either. USDT sits around 0.001% per hour year-round, while the borrow rate on the small caps that carry deep negative funding can multiply several times over in a single day. A row that penciled out at open can stop penciling out mid-hold.
5. Contracts heading for delisting: the later periods never happen
The rows at the very top of the table often have something in common, and it is not that the opportunity is good.
A contract on its way out usually carries the highest funding on the market. We measured SCRTUSDT at 0.0684% for one period — six times the exchange baseline, which puts it first by annualised yield. But the return model is “hold for the break-even count and earn the round trip back”, and the contract stops before that. You pay all four taker fills and collect funding for a handful of periods.
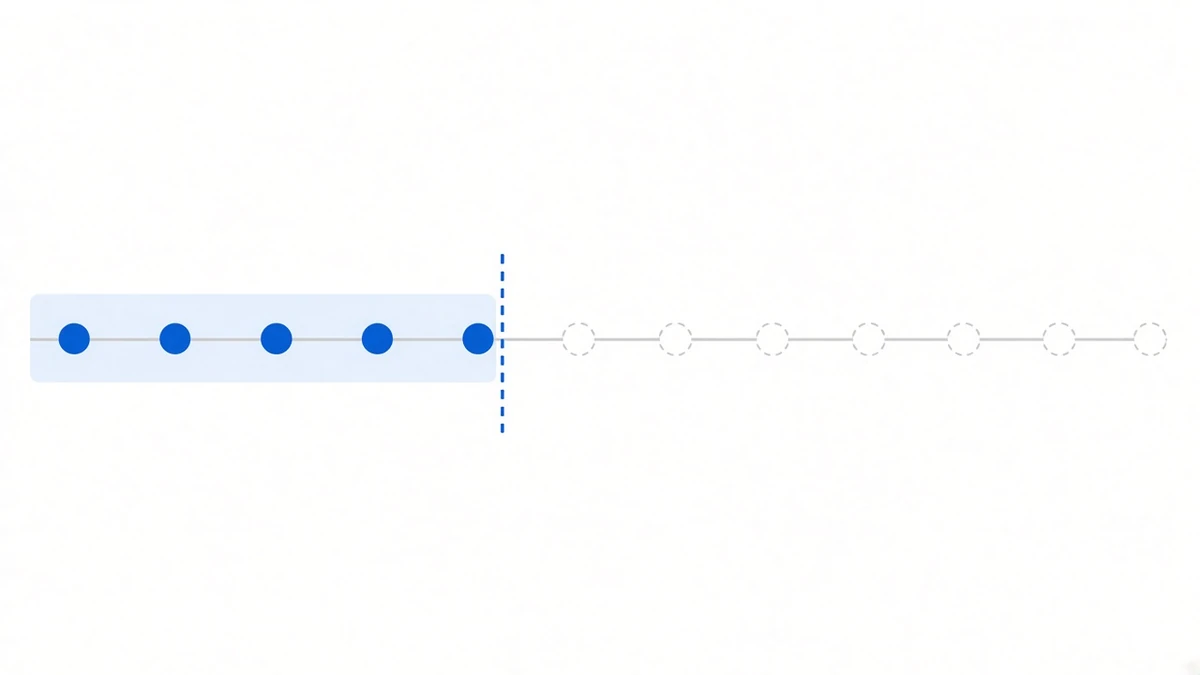
Worse than “about to delist” is already in settlement — at that point you collect nothing at all.
6. Orders that never go out: collateral rate and borrow inventory
This last group does not eat into returns directly; it costs time and opportunity. It is just as invisible on the table.
- A collateral rate of zero. Buying spot inside a unified account is not a debit from your wallet — it converts quote currency into collateral, and account collateral value immediately drops by
notional × (quote collateral rate − base collateral rate). We measured HEMIUSDT at a collateral rate of 0: 725 USDT in the wallet, a buy notional of only 199.75, six pre-checks all green, and the order simply would not go out. The exchange returned-2019 Margin is insufficient. - Empty borrow inventory. Whether you can borrow at all depends on whether other people have repaid. One live scan priced 15 rows; 13 of them had zero inventory — and the highest annualised rows were all among those 13.
There is a quieter one behind both: turnover. The spread column describes the top of the book only and says nothing about the depth behind it. A coin with a 0.1% spread that trades a few tens of thousands of dollars a day will push you several levels down as soon as the notional grows, and what you actually pay is far more than half a spread — none of which that column can show you.
How to read the table
Go down it asking six questions. Was this row’s direction re-decided at submission time? Does the cost include the spread? How many periods to break even, and will the rate last that long? Does this side need borrowed coins, and on which ratio is the interest charged? Is the contract scheduled for delisting? Do the collateral rate and borrow inventory let the order through?
Any question you cannot answer turns that row’s annualised yield back into a nice-looking number.
Where the rate comes from and how the formula breaks down is in how the funding rate is calculated; the full arithmetic for the other side of the sign is in what negative funding means; how the two legs land together, and what happens when one of them does not, is in why delta neutral is hard in practice. For what the year-by-year results look like once these leaks are plugged, six years of funding puts the worst year and the best year on the same table, or read the track record directly.