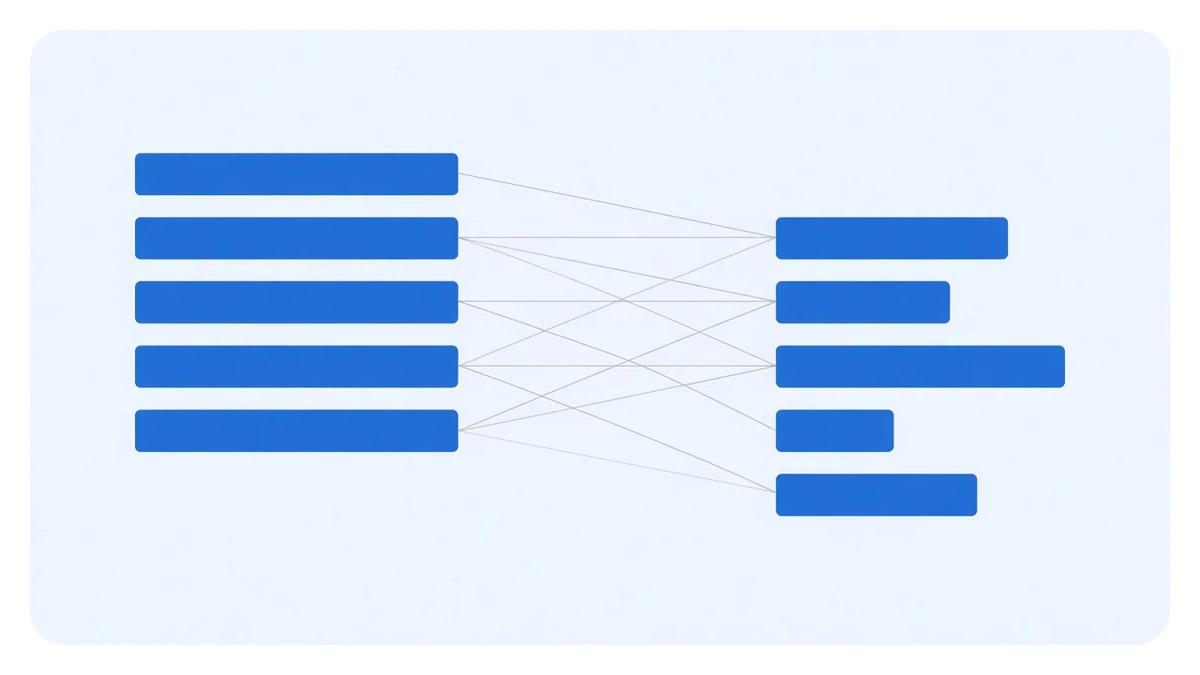
Every funding scanner answers the same question: which contract had the highest funding rate over the period just past. You are reading the board to learn something else: which contract will have the highest funding rate over the period just ahead.
The distance between those two questions is measurable. We treated every day of 2026 as a scan: for each of the 450 Binance USD-M contracts in our database, sum the trailing seven days of funding, rank, take the leader, then look at what it actually paid over the next seven days. 254 trading days have a complete window on both sides.
The result is more interesting than the board is all noise:
| Value | |
|---|---|
| The seven days that put the leader on top | 2.9327% |
| What it collected over the next seven | 1.3122% |
| Median of the next seven days | 1.7662% |
| Delivery rate (next seven / prior seven) | 44.7% |
| Days the next seven days were negative | 20 / 254 (7.9%) |
| Worst single week | −21.8788% |
The leader does keep paying — 1.3122% over seven days is not a small number. But it is less than half of the number that got it ranked. You see 2.93% and act; you receive 1.31%.
Why it decays, and why roughly by half
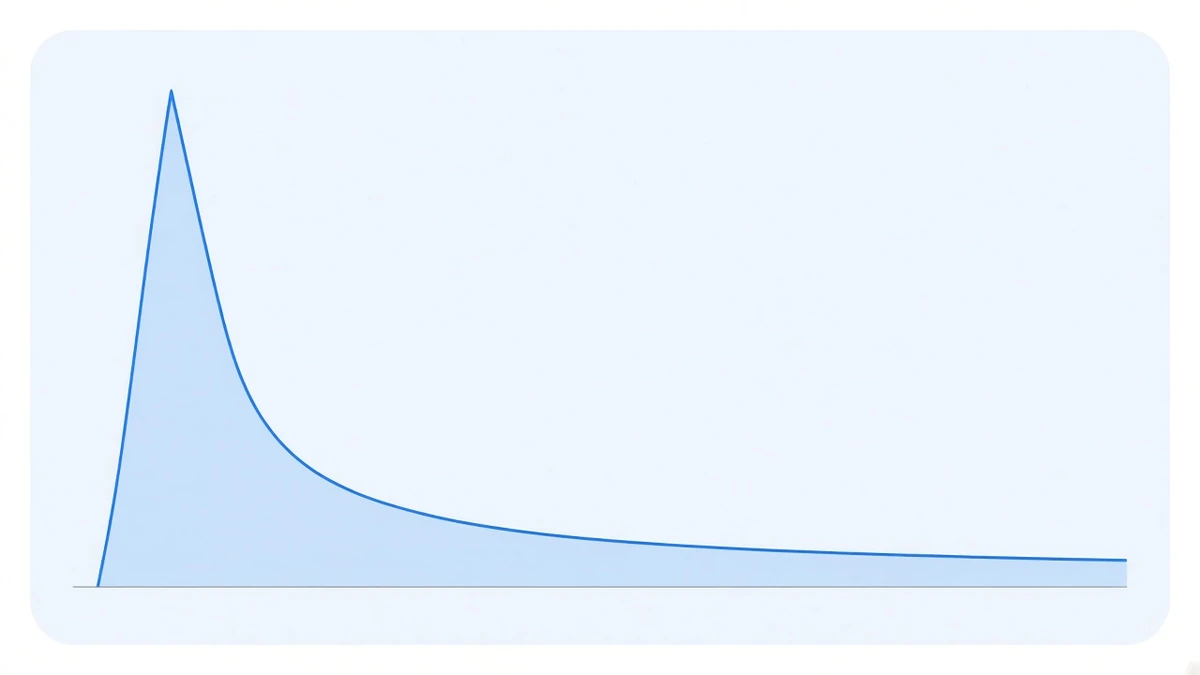
Funding is not a yield. It is the price of crowding. A contract at the top of the board is one where longs are paying a lot right now to stay long. High rent attracts two kinds of participant at once: arbitrageurs willing to take the other side, and longs who close. Both push the rate back down.
So the top of the board is structurally a mean-reverting seat: a contract usually got there because something specific happened in those seven days — a listing, an unlock, a burst of meme flow — and that thing does not happen twice. A 44.7% delivery rate is the price of that mechanism.
But the board is not random either
This was the surprise in the re-run. Take each day’s top ten and check later whether they are still there:
| Of today’s top ten | Average still present |
|---|---|
| In the top ten 7 days later | 5.39 / 10 |
| In the top ten 30 days later | 4.03 / 10 |
| In the top fifty 30 days later | 8.78 / 10 |
Four still in the top ten a month later, nearly nine still in the top fifty. That is not how a random sequence behaves — drawing at random from 450 contracts, the expected number still in the top ten a month later is 0.22.
The first place is more concentrated still: across 261 ranking days, only 16 contracts ever held it.
| Contract | Days at number one |
|---|---|
| ESPORTSUSDT | 65 |
| BULLAUSDT | 62 |
| GUAUSDT | 39 |
| 1000000BOBUSDT | 35 |
| BTWUSDT | 17 |
| LYNUSDT | 11 |
| Other 10 combined | 32 |
So the accurate statement is not the board is useless. It is: the board tells you which contracts are in a high-funding state, but not how much of that number you will receive. The first part carries real information. The second needs to be halved.
Those 20 days are the ones to look at
On 20 of 254 days, the leader was net negative over the following week. The worst of them: −21.8788% in seven days.
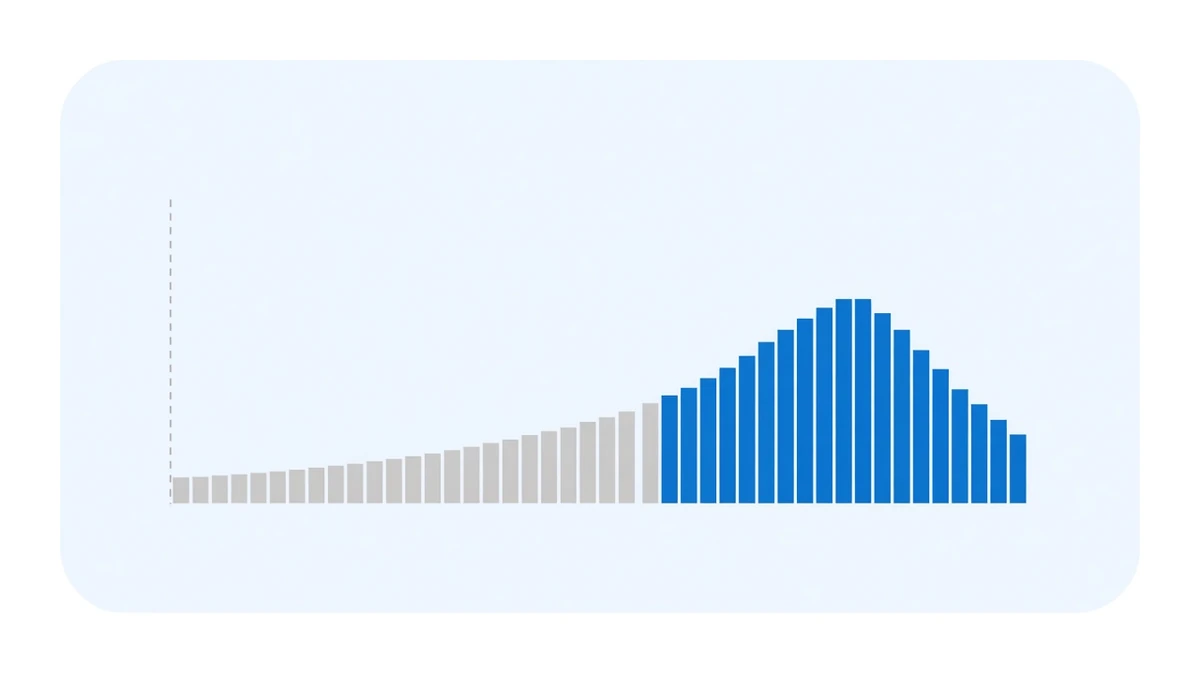
The shape of this distribution matters far more than its mean. Average +1.31%, median +1.77%, worst week −21.88%: that is a distribution with a long tail on the left. The median sitting above the mean says most weeks are fine and a few drag the average down.
And the scanner shows you one number. It will not tell you this contract has already played out its week, nor that it happens to be in that 7.9%. Binance USD-M contracts have a hard cap of plus or minus 2% on a single period, and this year only the floor has been reached — 145 times, with the ceiling never touched. That asymmetry is in the top of the funding leaderboard made 56% this year.
Four things the scanner does not show
The delivery rate is only the first. The other three are not in the table at all:
- Whether the spot leg is buyable. Contracts at the top usually have thin spot books, and the bid-ask spread alone can eat several periods. Some have no spot market at all, so the two legs cannot be assembled.
- How many periods it takes to earn back the round trip. Four fills at listed rates come to 0.30%, an arithmetic worked through in holding only across the settlement.
- The share of periods that were negative. Two contracts with the same mean — one that has never printed a negative period, one paying out on half of them — are different businesses.
- It only counts contracts that still exist today. Anything that ranked and was later delisted is not dragging down any average.
Only the first of those needs a look at the order book; the rest fall out of per-settlement data. The six costs that never appear in the table are in six hidden costs; which ceiling you hit first as size grows is in how much money fits.
Three ways to use a scanner properly
- Use a rolling window, not year-to-date cumulative. A year-to-date column mixes in how long the contract has existed and how many times a day it settles — two factors that have nothing to do with you.
- Treat the delivery rate as a default haircut. Seeing 2.9%, plan around 1.3%. That is the measured mean over 254 days, not a conservative guess.
- Read the worst week before the average. −21.88% and +1.31% happened in the same seat.
We do not rotate symbols off the board ourselves, and the 44.7% table is the reason: rotation creates a certain cost that has to be paid out of an expected return already trading at half price. Symbol selection is a source of risk rather than return in this strategy, which is developed in which coins suit funding rate arbitrage; our own year-by-year record is on performance.
Data: per-settlement funding rates from our own collection database (sourced from Binance’s public USD-M endpoints), window 2026-01-01 00:00 UTC to 2026-09-24 03:00 UTC, 450 symbols. Ranking method: sum each calendar day’s funding in UTC, then take the trailing seven calendar days inclusive (sum of periods, not compounded); contracts without a full seven-day window are not ranked. 254 days support the next seven days comparison; the top-ten overlap comparison uses a correspondingly shorter sample window; days at number one is measured over 261 ranking days. The random benchmark of 0.22 is 10 x 10 / 450. The board only contains contracts still trading at collection time. Contract tickers are shown to document the data, not as recommendations. Past data does not indicate future returns.