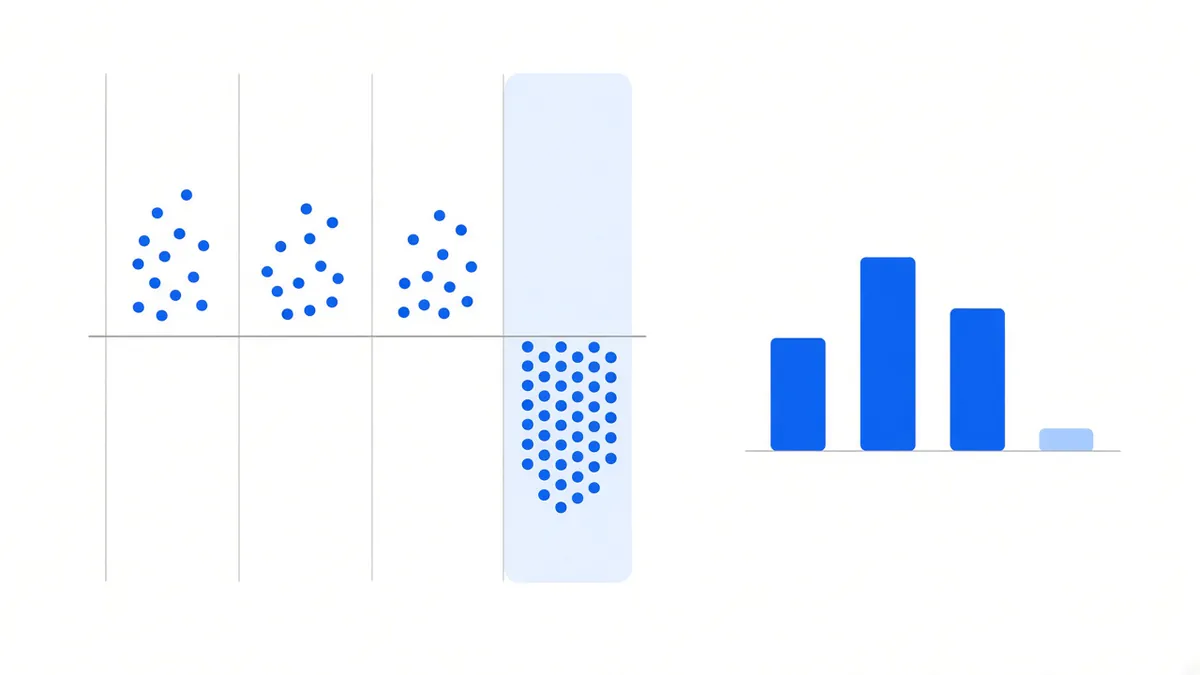
Start with the answer: a coin only qualifies if three things hold at once — funding stays positive across full years, the spot leg stays buyable and borrowable, and the contract is not going to be removed in a batch. Only the first is visible on a funding rate leaderboard, and it happens to be the least stable of the three.
The numbers below come from our own period-by-period settlement records, as of 2026-08-25 13:42 UTC. Periods are summed, not compounded.
One instrument, three windows, three conclusions
Four major USDT perpetuals, three readings taken at the same moment:
| Symbol | Latest period | Last 30 days | Year to date (711 periods) |
|---|---|---|---|
| BTCUSDT | 0.01% | 0.554163% | 1.589788% |
| ETHUSDT | 0.006736% | 0.426127% | 0.960325% |
| SOLUSDT | 0.01% | 0.381445% | −1.125987% |
| BNBUSDT | 0.007358% | 0.489349% | 1.812037% |
Look at the SOLUSDT row. Its latest print is 0.01% — identical to BTC. That is the standard cap tier, so on any leaderboard it sits right next to BTC and looks equally worth trading. One column to the left, the 30-day figure is positive too, at 0.381445%.
Now the last cell: summed across 711 periods this year, it is negative 1.125987%.
Same instrument, same moment, three windows, three different conclusions. If your selection rule is “whichever pays most right now”, SOL gets picked on almost any day this year — and across that year the funding on it went out, not in.
One correction worth making in passing: that 711 is a period count, not a day count. Settlement runs every eight hours, three per day, so 711 periods is roughly 237 days. Treating it as 711 days when annualising shrinks the result to a third of what it should be.
Funding reads sentiment, not asset quality
Funding tracks the gap between the perpetual price and spot, and that gap is a sentiment reading. However good a project’s fundamentals are, if its contract market is more pessimistic than its spot market over some stretch, funding is negative. What a negative funding rate means works through the relationship between sign and basis; here we only need its conclusion: the sign is set by basis, not by direction, and certainly not by project quality.
So “which coin pays the most” is really asking “whose longs are most impatient right now”. That answer changes daily, and your position cannot. Rotating both legs to a new symbol means two entries, two exits and two rounds of slippage. Six hidden costs measures those on our own account; a single rotation routinely costs more than the extra funding it was chasing.
Second test: the spot leg has to keep existing
This one is invisible on a leaderboard, and it can remove a leg outright.
The spot leg is not “buy it and leave it”. It depends on one specific trading pair staying listed, and on that asset’s borrowable inventory not being empty. Both are decided unilaterally by the exchange, and both get adjusted in batches.
The most recent instance is happening right now. Binance has announced that from 2026-09-18 06:00 UTC it will remove five cross-margin pairs — ENJ/USDC, GENIUS/USDC, CVX/USDC, GUN/USDC and VANA/USDC — with GENIUS/USDC also leaving isolated margin. Open positions are closed and settled automatically and pending orders are cancelled; the process takes about three hours, during which users cannot adjust positions. The underlying tokens are not delisted; those particular margin pairs simply stop existing.
For a one-sided position that is a notice to switch pairs. For a structure that needs both legs present simultaneously it is something else: three hours with your hands tied while the contract leg keeps moving. Notional balance does not hold during those three hours.
That is why, when screening, “will this pair still be here in three years” matters at least as much as “what does it pay today”. Half the reason majors are majors sits right here.
Third test: are there enough periods to audit
The third test is the dullest and it decides whether the history you are looking at means anything.
If an instrument listed recently, or went dark for a stretch, its period-by-period record has holes. A broken series will still produce a handsome average, and that average may rest on two or three months of samples. We keep a period-count column on the performance page and we set a hard line for what counts as a full year: years with fewer than 1,000 periods do not enter any average. At three per day a completed calendar year should have about 1,095; this year had 711 at the snapshot, so 2026 appears in the table but contributes to no average anywhere.
The same rule applies to picking instruments. On a symbol with only a few hundred periods, the annualised figure you compute is not an estimate, it is a guess.
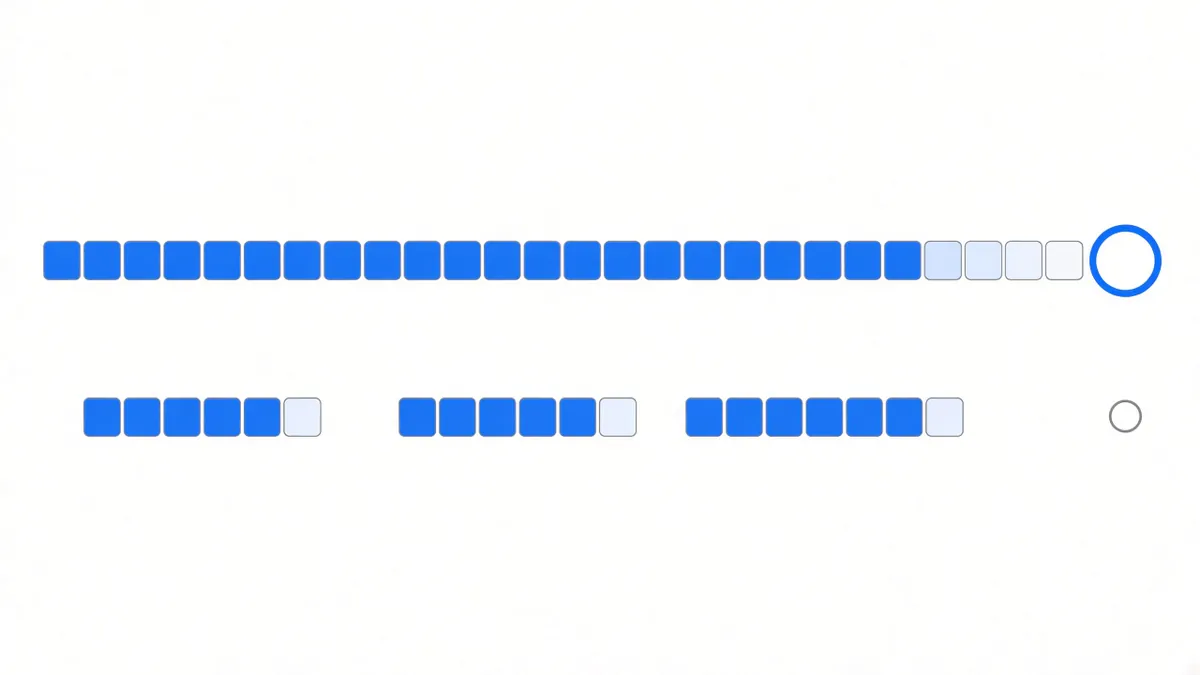
What survives all three
Run the USDT perpetual list through all three at once: funding positive across full years, the spot pair and borrow inventory stable over years, the record continuous enough to reconcile year by year. What is left is a single-digit count, and it is exactly the handful you already guessed.
We run a BTC strategy. That choice sounds conservative to the point of being uninteresting, but it is what makes all three conditions true at the same time. On the performance page every year from 2020 onward has a figure and a period count next to it, so it can be checked line by line. Across the five completed years from 2021 to 2025, BTC and ETH together averaged 12.43% a year in raw funding; with principal scaled ten times on an interest-free basis, 124.296%. The worst cell in that same table is ETH in 2022, which came to 7.873% for the whole year after scaling. It sits beside the good years, not somewhere else.
One thing not to do: rotate by leaderboard
“Pick the three highest-paying coins each week” sounds like yield optimisation. It does three other things instead:
- It swaps the return source for market timing. The moment funding is highest is usually the moment sentiment is most crowded, which is also the moment it falls back fastest.
- It multiplies costs. Every switch is four commissions plus two rounds of slippage, against funding that accrues one small period at a time.
- It destroys auditability. After enough rotation no symbol has a continuous record, and at year end you cannot say where the return came from.
The SOL row is what that costs. Any filter looking only at the current print selects it on almost any day this year, and after 711 periods the sum is negative.
Coin selection is not where the return comes from — settlement is. The return is the funding payment itself, handed from longs to shorts at every settlement point. Selection only decides whether you hand part of it back on some symbol. For how we fix the instrument, the two legs and the cost basis, how it works goes into more detail.
In flat and bear markets funding drifts toward zero and can turn negative. That is a condition this strategy genuinely runs into, and the 2022 row is what it looks like. Switching to a higher-paying coin does not solve it — SOL’s negative sign this year is precisely where “switch to a higher-paying coin” leads.
Sources: our own figures come from the backend period-by-period funding snapshot, as of 2026-08-25 13:42 UTC. The margin pair removal timing and scope come from Binance’s official announcement (published 2026-09-15, effective 2026-09-18 06:00 UTC). Past data does not indicate future returns.