Plenty of people use a perpetual instead of spot: no withdrawals, no wallet, just a 1x long that moves exactly like the coin. There is one difference. A long perpetual settles funding every period, paying shorts when the rate is positive and collecting from them when it is negative.
How much is that? Summing Binance’s BTCUSDT and ETHUSDT perpetuals period by period, for a 10,000 USDT long held throughout:
| Year | BTC funding for the year | Paid on a 10,000 USDT long | ETH funding for the year | Paid on a 10,000 USDT long |
|---|---|---|---|---|
| 2021 | 30.64% | 3,064 | 37.56% | 3,756 |
| 2022 | 4.16% | 416 | 0.79% | 79 |
| 2023 | 7.84% | 784 | 8.24% | 824 |
| 2024 | 11.98% | 1,198 | 13.02% | 1,302 |
| 2025 | 5.13% | 513 | 4.94% | 494 |
| 2026 (to 27 Sep) | 2.16% | 216 | 1.39% | 139 |
Method: sums of periods, not compounded; notional held fixed at 10,000 USDT regardless of price; fees excluded.
Over the five full years from 2021 to 2025, a BTC long paid 59.76% in total, or 5,976 USDT on 10,000 of notional; for ETH it was 64.54%, or 6,454 USDT.
The most expensive year was the one you most wanted to hold
2021, BTC’s strongest year, was also when a long perpetual cost the most: 30.64% over the year. In February 2021 alone, BTC funding summed to 7.24% and ETH’s to 8.53%. One month cost more than the whole of 2025.
The pattern is simple: the more crowded the longs, the higher the funding. The better the market, the more people want leveraged exposure, and the more a long perpetual costs to hold. In the 2022 bear market BTC paid just 4.16% for the year and ETH 0.79%. Why the rate is positive most of the time is covered in why funding is usually positive.
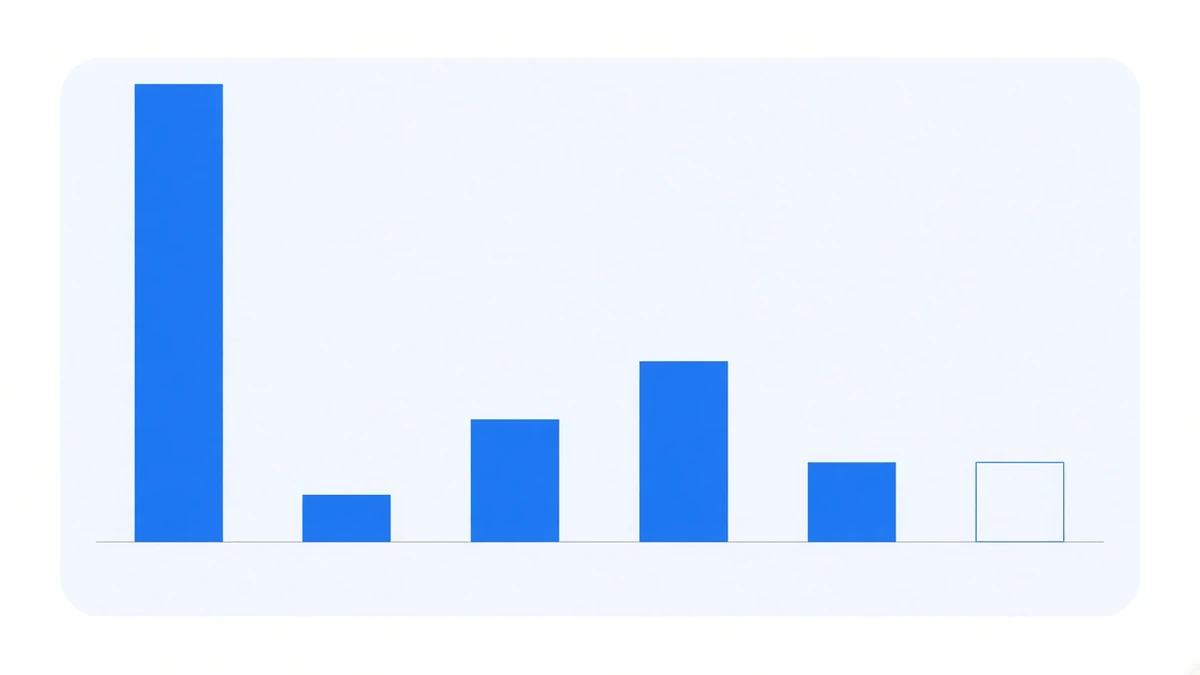
In 81 months, longs got paid in only 6
When the rate is negative, the long collects instead. From January 2020 to September 2026 there are 81 months; summing by UTC month:
- BTC had 6 negative months: March 2020, July 2021, November 2022, and February, March and April 2026. The most negative was March 2020, at −0.53%.
- ETH also had 6: June, September and November 2022, and February to April 2026. The most negative was September 2022, the month of the Merge, at −1.56%.
This year is unusual: BTC was negative three months running from February to April (−0.06%, −0.09%, −0.18%), turned positive in May, paid +0.57% in July and +0.62% in August, and +0.42% in September to the 27th. How long funding can stay negative is worked out in how long funding can stay negative.
Who receives the money
Funding does not go to the exchange. It changes hands directly between the two sides: longs pay, shorts receive. Part of the receiving side is funding rate arbitrage, buying spot and shorting an equal amount of the perpetual so price moves cancel and only the funding remains (what is a funding rate).
So the table above is also the other side’s ledger: what long perpetual holders pay each year is what a balanced two-leg position collects. The yearly figures come from the same backend data as our performance page, including the worst year, 2022, and this year’s 2.16% so far.
Perpetual or spot?
This piece does not choose for you; it only lays out the differences:
| Spot | 1x long perpetual | |
|---|---|---|
| Price exposure | Yes | Yes, identical |
| Funding | None | Settled every period; BTC at 2.16% this year to 27 September |
| Liquidation | None | Hard to trigger at 1x, but still subject to the exchange’s margin and risk rules |
| What you hold | The coin itself | A contract position |
If you plan to hold for more than a year, funding is a real carrying cost, and it is highest in bull markets. For price exposure without it, spot and dated futures are the other two routes; a dated future’s cost shows up in its basis instead, see perpetual versus dated futures.
Data and method: yearly rates come from our backend snapshot (the same source as the performance page, as of 2026-09-27 00:38 UTC): Binance BTCUSDT and ETHUSDT perpetual funding summed period by period, not compounded, with 809 settlements in 2026; 2020 has an incomplete settlement count and is left out of the table. Monthly figures are summed by UTC month from our collection database, built on the same public USD-M endpoint fapi/v1/fundingRate, and may differ by a few thousandths of a point from months cut in another time zone. “Paid on a 10,000 USDT long” assumes fixed notional of 10,000 USDT, ignores the effect of price changes on notional value, and excludes fees and slippage. Nothing here is investment advice. Past data does not indicate future returns.