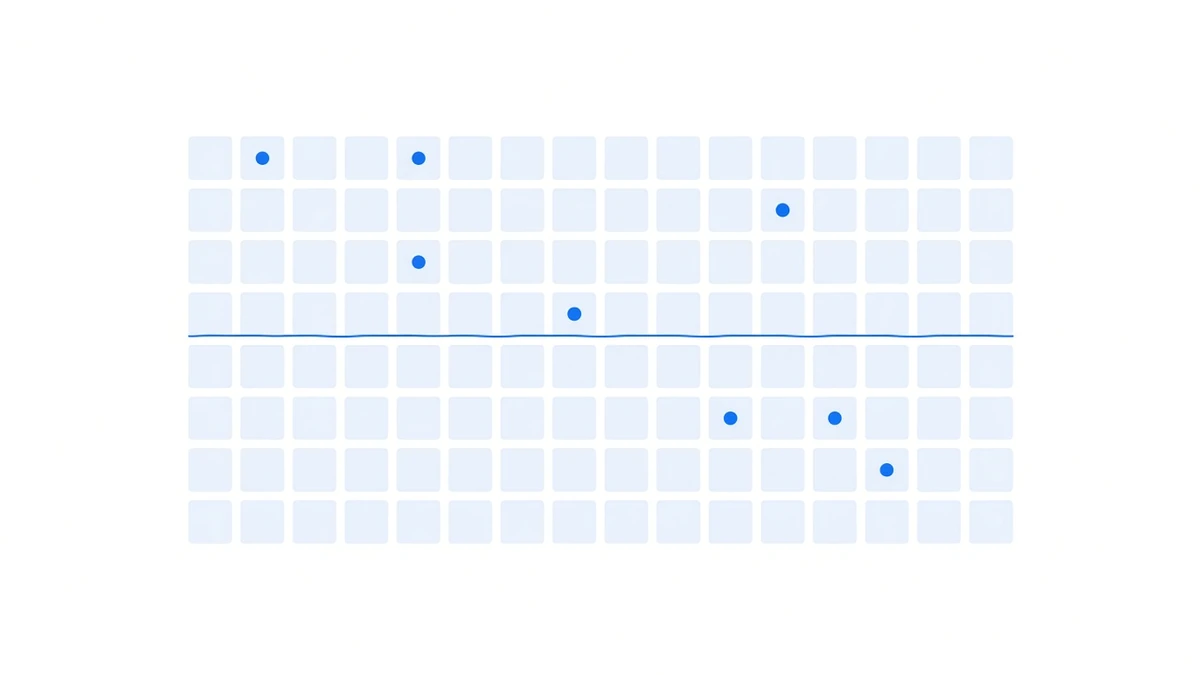
Every Fed meeting puts crypto on edge. Prices can swing hard, but what about funding? If you hold a balanced two-leg position, the question that matters is whether funding turns negative around the decision.
The short answer: nothing unusual happens. Taking all 46 FOMC meetings from January 2021 to September 2026 and comparing the average BTC funding rate over the three settlements before each statement with the three after:
- the median size of the change is 0.0015 percentage points;
- the same comparison at an arbitrary point in the same period has a median of 0.0021 points.
Funding moves less across a Fed decision than across an ordinary day. ETH is the same: 0.0022 against 0.0023.
46 meetings: 12 hikes, 6 cuts, 28 holds
Meeting dates come from the FOMC calendar on the Federal Reserve’s website, and rate changes from the target-rate table on its open market operations page. The statement is released at 2 p.m. Eastern, which is 18:00 UTC in daylight time or 19:00 UTC in winter. Binance’s BTC perpetual settles at 00:00, 08:00 and 16:00 UTC, so “three before” are the three settlements on the decision day and “three after” are the three on the next day.
| Decision | Meetings | Average, 3 before | Average, 3 after | Higher / lower | Negative periods, 9 before → 9 after |
|---|---|---|---|---|---|
| Hike | 12 | 0.005416% | 0.005641% | 7 / 4 | 14 → 13 |
| Cut | 6 | 0.005838% | 0.005769% | 2 / 3 | 2 → 5 |
| Hold | 28 | 0.008483% | 0.008693% | 13 / 10 | 33 → 33 |
(Beyond higher and lower, one hike, one cut and five holds left the average unchanged.)
Funding did not fall after hikes; on average it edged up. It did not rise after cuts either. Widening the window to nine settlements (three days) each side, negative periods went from 14 to 13 around hikes and stayed at 33 around holds. Around cuts they went from 2 to 5, but with only six meetings a difference of three periods says little.
The biggest moves had other causes
Ranked by the change in the three-period average, BTC’s five largest moves:
| Decision date | Decision | Average, 3 before | Average, 3 after |
|---|---|---|---|
| 2022-09-21 | Hike, 75 bp | 0.003132% | −0.003649% |
| 2023-09-20 | Hold | −0.002461% | 0.003901% |
| 2022-01-26 | Hold | −0.001786% | −0.007536% |
| 2022-07-27 | Hike, 75 bp | 0.004209% | 0.009743% |
| 2024-05-01 | Hold | 0.009616% | 0.004227% |
The largest, on 21 September 2022, flipped BTC funding from positive to negative. But that week the market was also digesting the Ethereum Merge: on the day of the Merge, 15 September, ETH settled at −0.3019%. With several things happening at once, it is hard to pin that move on the Fed. The same 75 bp hike on 27 July pushed funding the other way, from 0.0042% to 0.0097%. The five do not even agree on direction, let alone form a pattern.
The most recent was 16 September 2026: a 25 bp hike, the Fed’s first since July 2023. BTC’s average went from 0.0040% for the three settlements before to 0.0071% for the three after, with no negative period in the nine on either side. Shorts were the ones liquidated that week, yet funding was never squeezed higher; see the Fed hiked, shorts were squeezed, funding stayed flat.
Rate levels and funding levels do not line up either
Stretching to whole years, set the policy rate against full-year funding:
| Year | Fed funds target at year-end | BTC funding for the year | ETH funding for the year |
|---|---|---|---|
| 2021 | 0–0.25% | 30.64% | 37.56% |
| 2022 | 4.25–4.50% | 4.16% | 0.79% |
| 2023 | 5.25–5.50% | 7.84% | 8.24% |
| 2024 | 4.25–4.50% | 11.98% | 13.02% |
| 2025 | 3.50–3.75% | 5.13% | 4.94% |
| 2026 (to 27 Sep) | 3.75–4.00% | 2.16% | 1.39% |
2021 had zero rates and the highest funding. 2023 had rates above 5% and higher funding than 2022. In 2024 rates were still above 4% and BTC funding was the second highest of these six years. Funding follows how badly longs want leverage, not the fed funds rate.
One common misunderstanding: the “interest rate” term in Binance’s funding formula is a fixed parameter the exchange sets for each contract (0.01% per eight hours for BTCUSDT). It does not follow the Fed. Its role in the formula is explained in how funding rates are calculated.
What it means for a balanced position
- Fed days need no special handling for funding. None of the 46 produced a change you would not see on an ordinary day.
- Guard against price, not funding. Prices can swing hard on Fed days. In a balanced position the spot and perpetual gains and losses cancel, but the perpetual leg’s margin still moves with price, and if the buffer is thin the first problem is liquidation (why a balanced position can still be liquidated).
- In high-rate years, compare funding with the risk-free rate. BTC funding is at 2.16% for 2026 to 27 September; what is left after the risk-free rate is worked out in funding after the risk-free rate. Yearly figures, including the worst year, are on the performance page.
Data and method: FOMC meeting dates come from the Federal Reserve’s meeting calendars, and target-rate changes and levels from the table on its Open Market Operations page (dates in that table are effective dates, the day after the decision), both read on 2026-09-27; statement times are 14:00 US Eastern converted to UTC. BTCUSDT and ETHUSDT per-period funding rates come from Binance’s public USD-M endpoint fapi/v1/fundingRate, via our collection database, 2021-01-01 to 2026-09-27. The “arbitrary point” baseline takes a point every three settlements from 2021 and measures the absolute change between the three-settlement averages either side, 2,093 points in all. Yearly funding comes from the same source as the performance page, summed per period and not compounded. Past data does not indicate future returns.