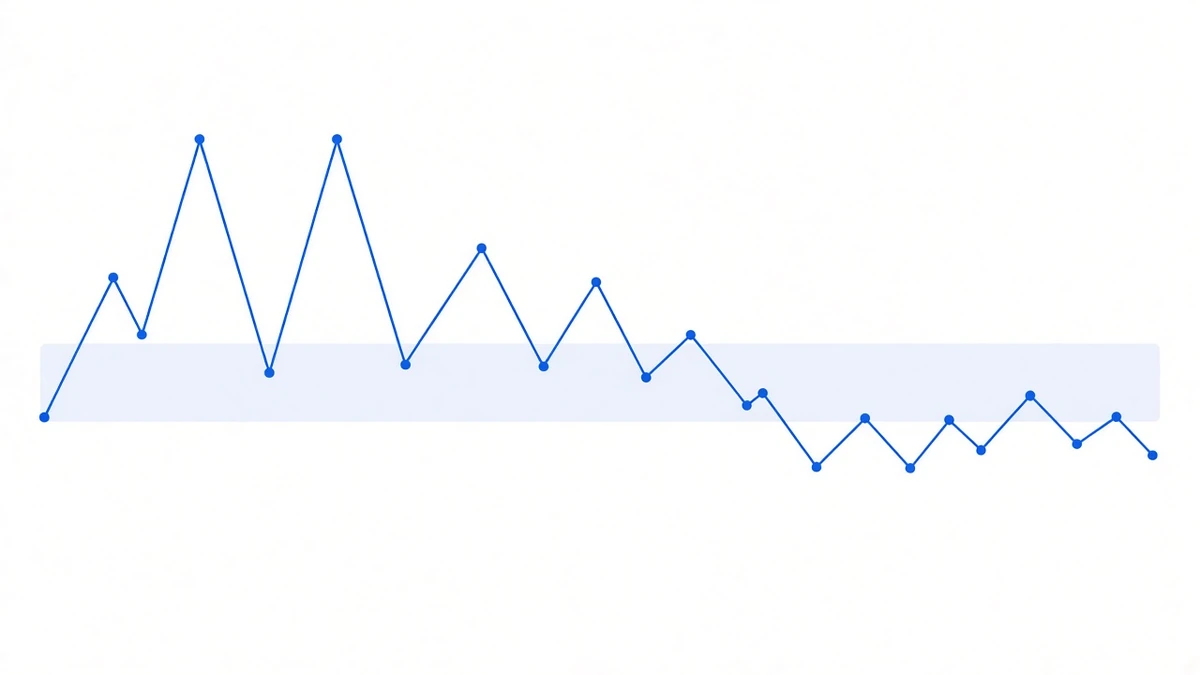
The conclusion first, because it works against us: on gross funding, this strategy is not beating short-dated dollar paper this year.
Re-pulling this year’s settlements from Binance’s public USDT-margined futures endpoints (read 2026-09-20 14:11 UTC, covering 788 periods from 2026-01-01 through 09-20 08:00):
| Symbol | Year to date | Annualised |
|---|---|---|
| BTCUSDT | +2.091425% | 2.910% |
| BNBUSDT | +2.059435% | 2.865% |
| ETHUSDT | +1.265904% | 1.761% |
| SOLUSDT | −0.960962% | −1.337% |
The risk-free side over the same stretch: the Federal Reserve voted 12–0 on 16 September to raise the federal funds target range by 25 basis points to 3.75%–4.00%, and the 10-year Treasury touched 5.041% intraday on 15 September, its highest since 2007.
The best row in that table, 2.910%, is below the lower bound of the federal funds target range. There is no “but” in this section.
Why: it is rent, not interest
The words “funding rate” make it sound like a form of interest. It is not.
It is a payment leveraged longs on a perpetual contract make to shorts every 8 hours to keep their position. Whether it is paid and how much depends on how badly people want to be long at that moment, not on any central bank.
This year’s numbers make the point cleanly. Consider a statistic almost nobody bothers to compute:
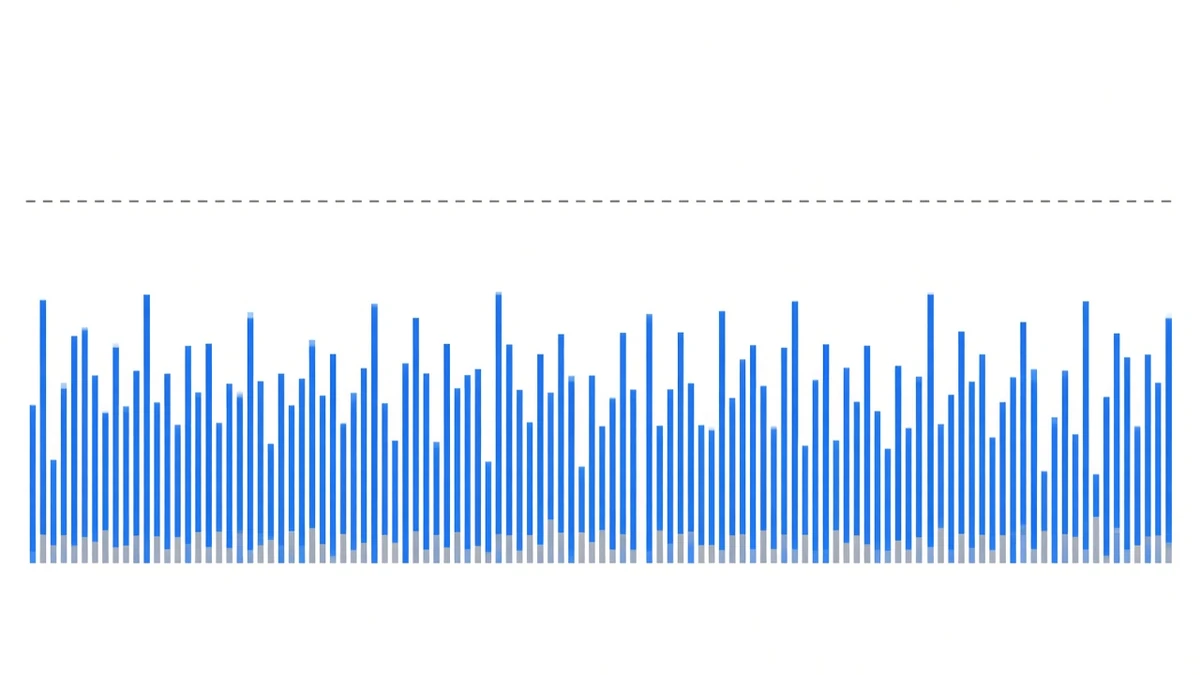
Across this year’s 788 periods, BTCUSDT’s highest single-period rate is exactly 0.010000% — it never once exceeded the 0.01% baseline. The same holds for ETHUSDT and SOLUSDT.
Under Binance’s published formula (rate = premium index + clamp(interest rate − premium index, ±0.05%)), for funding to exceed 0.01% the premium index first has to clear +0.06%. Across a full 788 periods, none of the three major symbols managed it once. How funding is calculated takes that formula apart.
Put another way: the perpetual market this year never produced a genuinely crowded long side from start to finish. No crowding, no rent.
Six years side by side
This year is not the norm, but neither is it an accident. Opening up the yearly table (back-office snapshot as of 2026-08-25 13:42 UTC, added convention):
| Year | BTCUSDT | ETHUSDT |
|---|---|---|
| 2021 | 30.635167% | 37.562125% |
| 2020 | 18.764618% | 31.581038% |
| 2024 | 11.98048% | 13.01854% |
| 2023 | 7.842115% | 8.237886% |
| 2025 | 5.132678% | 4.935192% |
| 2022 | 4.164925% | 0.787256% |
| 2026 (incomplete) | 1.589788% | 0.960325% |
BTC paid 30.635167% across 2021; subtract any risk-free rate you like from that year and a large slice remains. ETH paid 0.787256% in 2022; subtract and it is negative.
Excess return is not a constant in this strategy, it is a cyclical variable, and it swings more than most people expect — the standard deviation of the BTC column is 9.449693. The 2020 cells have an unknown period count and cannot be averaged in with complete years; 2026 is only part-run, same caveat. We publish both blemishes alongside the numbers, and the yearly table is annotated the same way.
“Different source” does not mean “higher”
Short-dated paper and funding earn from entirely different places:
- Short-dated paper: return comes from sovereign credit, set by policy rates, unrelated to crypto sentiment.
- Funding: return comes from other traders’ demand for leverage, with no direct transmission from policy rates.
Different sources mean the two do not have to move together, and that is a genuine property. This year is an example: the Fed was hiking while funding drifted down.
But “uncorrelated” is routinely swapped for “higher.” Those are unrelated claims. This year’s measurement is simply this: policy rates went up, funding went down, and the two lines crossed in September. Past the crossing, the person holding short-dated paper earns more and does not carry anything in the next section.
The risk you are not giving up has to be counted
If you are going to compare yields in one table, the asymmetric parts belong in it too:
| Short-dated dollar paper | Funding rate arbitrage | |
|---|---|---|
| Source of return | Sovereign credit | Leverage demand from perpetual longs |
| Can the return go negative | Not if held to maturity | Yes — SOL did this year |
| Counterparty | The Treasury | The exchange (plus the platform when managed) |
| Directional price risk | None (held to maturity) | None (two legs balanced) |
| Execution risk | None | Yes: both legs have to land together |
| Liquidation risk | None | Yes, the futures leg is margined on its own |
The last three rows are what this approach takes on additionally, and counterparty risk and liquidation each have a piece of their own.
So given this year’s numbers, the honest statement is: it carried more kinds of risk and earned a lower gross return. That sentence was reversed in 2021, and nobody knows what it looks like next year.

What to watch next (no forecasts)
Three observable readings, all of which you can pull yourself:
- Whether a single period clears 0.01% again. If it does, the premium index is back above +0.06% and leveraged longs are crowding again. It has not happened once this year.
- The share of negative periods. BTC has 209 negatives out of 788 this year, 26.52%; SOL has 390, or 49.49% — close to half. That ratio moves before the cumulative figure does.
- Whether funding follows when open interest rises. If open interest climbs and funding does not, the money coming in is not leveraged longs — we measured exactly that in the 18 September note.
So what makes the product work this year
This is the only honest place to land.
Everything above concerns the gross rate. What plan one offers is a 7% floor on the net-of-fees annual figure: whatever the strategy does in a given year, the investor receives at least 7% of principal, the platform makes up any shortfall, and all excess goes to the platform.
Put the 7% next to this year’s 2.910% and the gap is what the platform is carrying. Which is precisely why what stands behind that number is platform credit, not market conditions. That is the entire reason plan one exists, and its price is giving up all of the upside — in a year like 2021, the excess goes to the platform.
Plan two guarantees principal but not returns; plan three guarantees neither and gives the investor seventy percent of the excess. All three carry a flat 2% annual management fee deducted from returns, and funds are held in a dedicated platform account, which carries platform credit risk. Terms are governed by the plans page.
Another way to put it: in high-funding years what you pay is the profit split; in a year like this one, what you are judging is whether the counterparty can absorb it. Those are two faces of the same contract, and the year decides which one is showing.
To finish the thought properly: funding approaching zero or turning negative in flat and bearish markets is something this approach genuinely runs into — the 0.787256% ETHUSDT line for 2022 on the track record page is how that happened. This year’s numbers look bad and we have not hidden them; equally, a good next year says nothing about the year after.
Sources: this year’s 788 settlement periods, the single-period maximum and the negative-period counts come from Binance’s public USDT-margined futures endpoints (read 2026-09-20 14:11 UTC, covering 2026-01-01 through 09-20 08:00 UTC); yearly totals and the standard deviation come from the back-office settlement snapshot (as of 2026-08-25 13:42 UTC) and are shown on the track record page; the federal funds target range and the 10-year Treasury reading are in the rate-hike note and the 5% Treasury note with their cited sources; the funding formula is Binance’s published definition; plan terms per the plans page. Past performance does not indicate future results, and this is not investment advice.