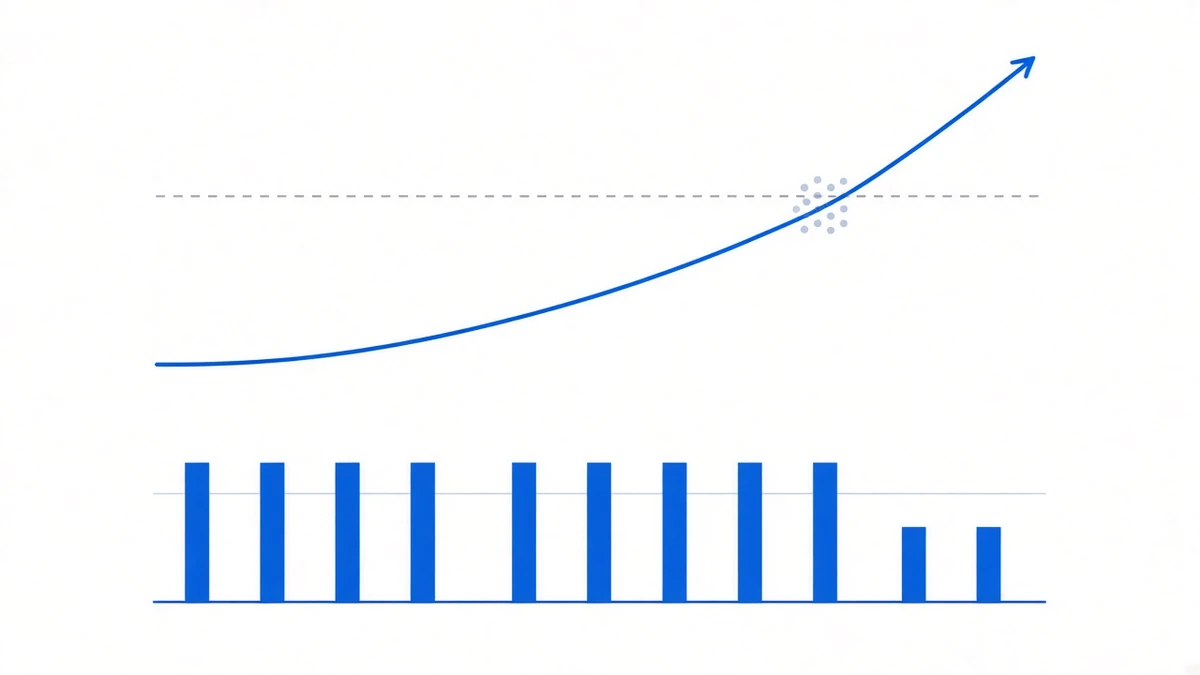
Bitcoin rallied hard on 18 September, touching $81,000 in the US pre-market, up roughly 6% over 24 hours. The trigger was two days earlier: the Federal Reserve raised rates 25 basis points on 16 September, but the projections published alongside the decision implied only one more hike this year. Markets read that as less hawkish than feared, and risk assets rebounded broadly.
Our previous note covered the day of the hike: the liquidated side flipped from longs to shorts, and funding never moved. Two days later the same thing happened at larger scale — and BTC funding did not just fail to rise, it fell below the 0.01% baseline.
Liquidations: four sources disagree, but agree on direction
All four cite CoinGlass and none of the numbers match, because the 24-hour windows close at different moments. We are listing the disagreement rather than splitting the difference:
| Source | 24h total | Shorts | Longs | BTC share |
|---|---|---|---|---|
| The Daily Hodl | $547M | $469.19M | $57.10M | ~$243.54M |
| PANews | $514M | $458M | $56.0811M | $236M |
| Crypto Times (14:40 UTC) | $507.06M | $449.71M | $57.35M | $237.77M |
| ChainCatcher / TechFlow | $495M | $440M | $54.9397M | ~$228M |
The absolute figures differ by more than fifty million dollars, but all four give essentially the same ratio: shorts were 88%–89% of the total. Trader counts range from 102,048 to over 107,000. The largest single liquidation is identical across all four: an $8.53 million BTC-USD position on Hyperliquid.
The same day, separate CoinGlass data put total BTC futures open interest up 8.21% over 24 hours, at $56.069 billion (Binance $11.946B, Gate $5.426B, Bybit $5.367B, OKX $3.015B).
Read together: a large batch of shorts was cleared out, and the glass refilled afterwards — open interest rose rather than fell, so new leverage came in. On the usual logic, that is precisely the setup in which funding gets pushed up.
Funding: three symbols went three different ways
We re-pulled the period-by-period settlements for the event window from Binance’s public futures endpoints (read at 2026-09-18 20:52 UTC; latest settlement 09-18 16:00 UTC). Our site snapshot stops at 2026-08-25, so the figures below were fetched live.
The period that contained the sharpest part of the move (09-18 08:00 → 16:00, mark prices):
| Symbol | 08:00 rate | 16:00 rate | Mark price move |
|---|---|---|---|
| BTCUSDT | 0.007903% | 0.006853% (down) | 77,776.00 → 80,688.80 (+3.7%) |
| ETHUSDT | 0.007752% | 0.010000% | 2,488.98 → 2,583.24 (+3.8%) |
| SOLUSDT | 0.010000% | 0.010000% | 105.76 → 111.14 (+5.1%) |
Three symbols rallied together, and the largest one’s funding went down.
Why 0.01% is the number that matters
Binance’s published formula is:
funding rate = premium index + clamp(interest rate − premium index, −0.05%, +0.05%)For USDT-margined contracts the default interest rate is 0.01% per 8 hours (the interestRate field in the API currently returns 0.0001).
Unfold that formula and a useful reading falls out:
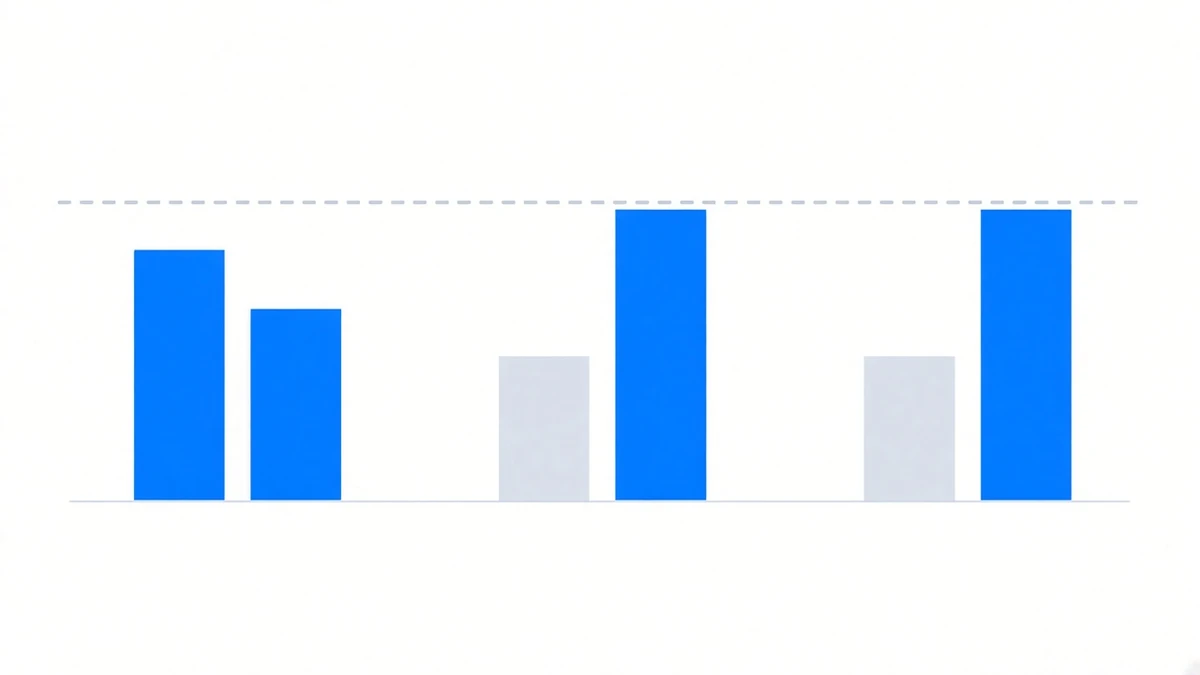
- When the premium index sits between −0.04% and +0.06%, the clamp does not bind and funding comes out exactly 0.01%.
- A reading of exactly 0.010000% therefore carries zero information — it only says the premium was somewhere in that dead band. It says nothing about how eager the longs were.
- A reading below 0.01% is real information: it requires the period-average premium index to have fallen through −0.04%, which means the perpetual traded at a meaningful discount to spot.
So the table above has to be read backwards: ETH and SOL printing 0.01% does not mean their longs were more crowded, only that their premium was in the dead band. The one that actually said something was BTC, and what it said was discount.
Working 0.006853% back through the formula puts BTCUSDT’s average premium index for that period at roughly −0.0431%.
The spot reading at the moment we pulled the data agrees: BTCUSDT’s mark price was 81,111.17 against an index price of 81,135.64 — the mark sat 0.030% below the index. The rate running into the next settlement was 0.006321%, lower still than the one just settled.
Put plainly: spot was rising and the perpetual did not keep up. This leg of the rally was driven by spot and by shorts being forced to close, not by leveraged longs chasing. Open interest rose 8.21%, but the leverage that came in clearly was not crowded enough to have to pay more rent.
What it means for a balanced two-leg position
Bluntly: nothing needed handling this round, and there was no good news either.
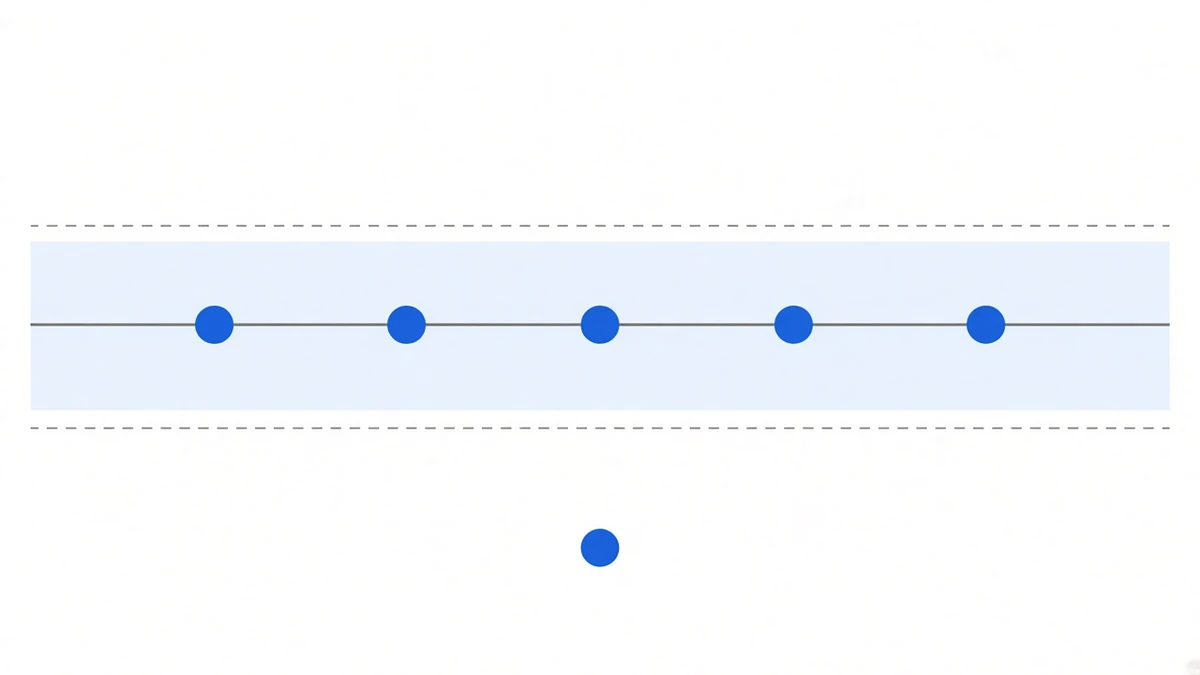
A spot long plus a perpetual short does not care whether BTC is 77k or 81k. It cares about one thing: did funding turn negative. It did not — BTC, ETH and SOL were positive across all three of 18 September’s periods (0.022525%, 0.021457% and 0.030000% respectively).
But that is all. A half-billion-dollar short squeeze plus an 8.21% expansion in open interest bought a lower BTC funding rate. For a position whose only income is funding, that is not a good reading.
Liquidation data does not enter our model. It is relevant in exactly one way: mass forced closing drains liquidity for a moment, and that is the worst possible environment for the two legs that have to move together — execution risk rather than funding risk, covered in delta-neutral in practice.
What to watch next
No forecasts. Three observables:
- Whether BTC’s reading gets back above 0.01%. If it does not, the perpetual is persistently at a discount, and that is a more informative signal than the price.
- Whether open interest holds after the jump. A rise that falls straight back means short-term speculation came in, not position demand.
- The premium index rather than the funding reading. Inside the dead band, funding flattens to 0.01% and whatever the premium is doing in there is invisible.
Funding approaching zero or turning negative in flat and bearish markets is something this approach genuinely runs into — the 0.787256% ETHUSDT line for 2022 on the track record page is how that happened, and SOLUSDT is at −1.125987% year to date. Funding did not turn negative this time; that does not mean it will not next time.
Sources: liquidation figures all cite CoinGlass, via The Daily Hodl, PANews, Crypto Times (as of 09-18 14:40 UTC) and ChainCatcher / TechFlow, with different window cut-offs; open interest from CoinGlass (via ChainCatcher, 2026-09-18); price and percentage move via IBTimes; period-by-period funding, mark/index prices and interestRate from Binance’s public USDT-margined futures endpoints (read 2026-09-18 20:52 UTC, latest settlement 09-18 16:00 UTC); the funding formula is Binance’s published definition; yearly totals on the track record page, site snapshot as of 2026-08-25 13:42 UTC. Past performance does not indicate future results.