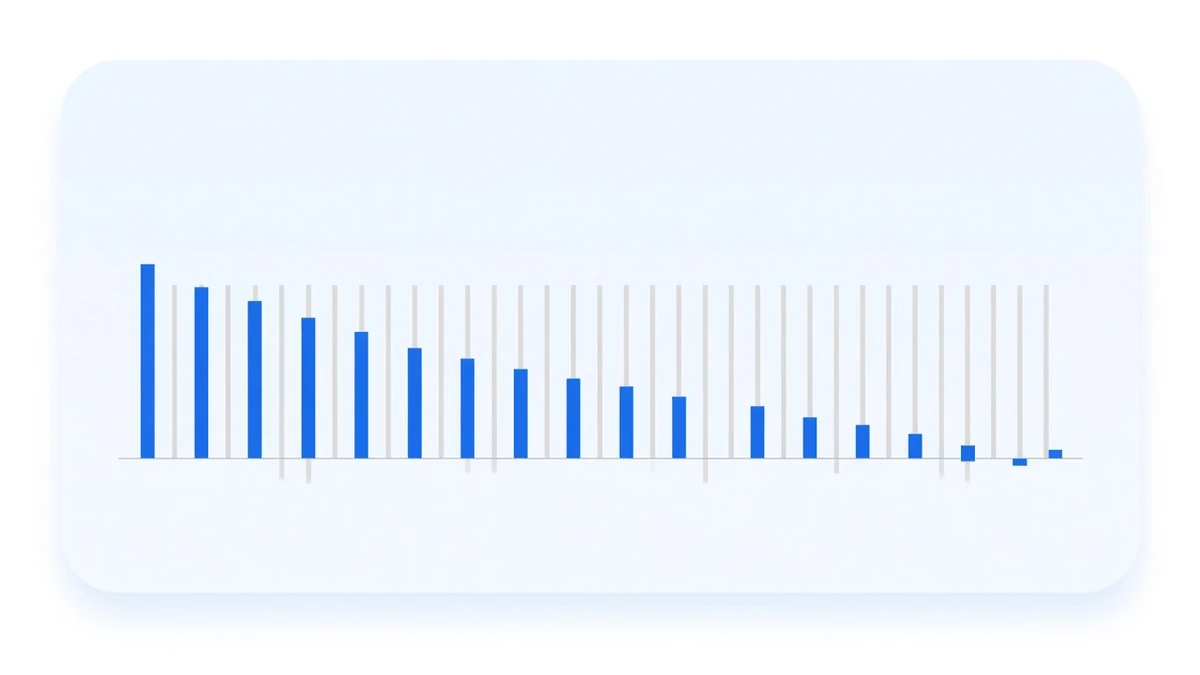
Binance’s BTCUSDT perpetual settled at −0.000574% at 16:00 UTC on 25 September, and at −0.000545% at the same time on 26 September. The previous negative period was 08:00 UTC on 5 September (−0.000150%), so these are the only two in 20 days. The 00:00 UTC settlement on 27 September was already back at +0.004703%.
Three days ago we wrote that BTC funding had fallen to 0.000132% over four periods without turning negative. This time it crossed the line. It was the only major that did.
Price: up to 87,385, then back to around 84,000
On Binance’s daily BTCUSDT perpetual candles (UTC days), BTC closed at $75,599.9 on 15 September, traded as high as 81,386.2 on the 18th and peaked at 87,385.1 on the 21st. Then it gave ground: 83,450.1 intraday on the 23rd, a low of 82,832.0 on the 24th, and a 83,130 to 85,224 range on the 25th and 26th, closing the 26th at 84,403.3.
Funding cooled before price did. Between 19 and 22 September, BTC settled at 0.010000% six times. That is the baseline Binance prints when the premium is small, and it means longs were paying in full. From 16:00 on the 22nd it dropped to 0.002784%, and across the 14 periods from there to 00:00 on the 27th, the highest print was 0.004930%:
| Settlement (UTC) | Rate | Mark price |
|---|---|---|
| 09-24 00:00 | 0.000132% | 84,355.10 |
| 09-24 08:00 | 0.004796% | 84,472.24 |
| 09-24 16:00 | 0.001422% | 84,374.30 |
| 09-25 00:00 | 0.000214% | 84,370.00 |
| 09-25 08:00 | 0.003512% | 83,994.60 |
| 09-25 16:00 | −0.000574% | 83,767.10 |
| 09-26 00:00 | 0.000769% | 84,056.00 |
| 09-26 08:00 | 0.004930% | 84,075.83 |
| 09-26 16:00 | −0.000545% | 84,112.50 |
| 09-27 00:00 | 0.004703% | 84,413.26 |
25 September was also the quarterly options expiry. The options ended that day; the perpetual settled three times as usual, at 0.000214%, 0.003512% and −0.000574%. The third of those was the first negative print of this stretch.
Across the market, both settlements were quiet
| Settlement (UTC) | Contracts settling | Negative | Share negative | Median | BTC |
|---|---|---|---|---|---|
| 09-25 16:00 | 447 | 32 | 7.16% | 0.005000% | −0.000574% |
| 09-26 16:00 | 447 | 22 | 4.92% | 0.005000% | −0.000545% |
Of the six majors we track (BTC, ETH, SOL, BNB, XRP and DOGE), BTC was the only one negative at either settlement. BNB printed exactly 0.000000% on the 26th, and zero is not negative: more than half of BNB’s periods this year are exactly zero, for reasons we covered in 233 Binance perpetuals have a zero baseline rate.
Zoom out and the picture gets clearer. On the three main eight-hour settlement times, the share of negative prints across the market was 39.64% in February and has fallen almost every month since. September so far is at 11.82%, the lowest month of the year. The single day of 26 September came in at 5.59%, 0.24 percentage points above the year’s low of 5.35% on 22 August. BTC turned negative. The market did not.
BTC and ETH swapped places this week
| Window (UTC, 21 periods each) | BTC total | BTC annualised | BTC negative | ETH total | ETH annualised | ETH negative |
|---|---|---|---|---|---|---|
| 09-13 to 09-20 | 0.137936% | 7.19% | 0 | 0.066863% | 3.49% | 5 |
| 09-20 to 09-27 | 0.084953% | 4.43% | 2 | 0.130003% | 6.78% | 0 |
The week before, BTC collected more than twice what ETH did. This week it was the other way round. ETH’s last negative period was 08:00 UTC on 16 September, and all 32 periods since have been positive.
What it means for a balanced position
Those two negative prints were real payments. On 10,000 USDT of notional, the short side paid 0.0574 and 0.0545 USDT. Over the same week the 21 periods still added up to +0.084953%, about 8.50 USDT. Price fell from 87,385 to around 84,000, and the spot long and the perpetual short moved against each other, so the principal did not change with it. A balanced book only cares about the sign of funding, and this week the answer was two negative periods inside a positive week.
The other side needs saying too. In February, March and April this year BTC had 45, 52 and 58 negative periods, and funding for those months summed to −0.063413%, −0.092486% and −0.177227%. Negative funding has come in long runs before, and those are the stretches where this strategy genuinely paid out; the year-by-year record is on the performance page. This time it was two isolated periods. That does not mean the next time will be.
What to watch
- Whether BTC’s negative periods start to cluster. From February to April there were dozens a month. This stretch has had two in 20 days, and the 27 September 00:00 print was positive again.
- The market-wide negative share. It is around 5%, in the lowest range of the year. If it rises together with BTC, that is a market-level turn.
- Do not read a pattern into both prints landing at 16:00. Over six years of settlements, 16:00 UTC is actually BTC’s highest-paying slot on average; within 2026 alone, the three settlement times differ by less than 0.00014 percentage points. The detail is in does funding have a seasonal pattern.
Sources: per-period BTCUSDT and ETHUSDT funding rates and mark prices come from Binance’s public USD-M endpoint fapi/v1/fundingRate and match our own collection database period for period; the latest period is 2026-09-27 00:00 UTC. Daily BTCUSDT perpetual candles come from fapi/v1/klines (UTC days). Market-wide figures (negative counts and medians for the 447 contracts settling at 16:00 UTC on 25 and 26 September, and 2026 monthly and daily negative shares) come from our collection database; the monthly and daily shares count only settlements at 00:00, 08:00 and 16:00 UTC. Weekly totals are sums of periods, not compounded; annualised figures are the weekly total ÷ 7 × 365. Tickers are shown to document the data, not as recommendations. Past data does not indicate future returns.