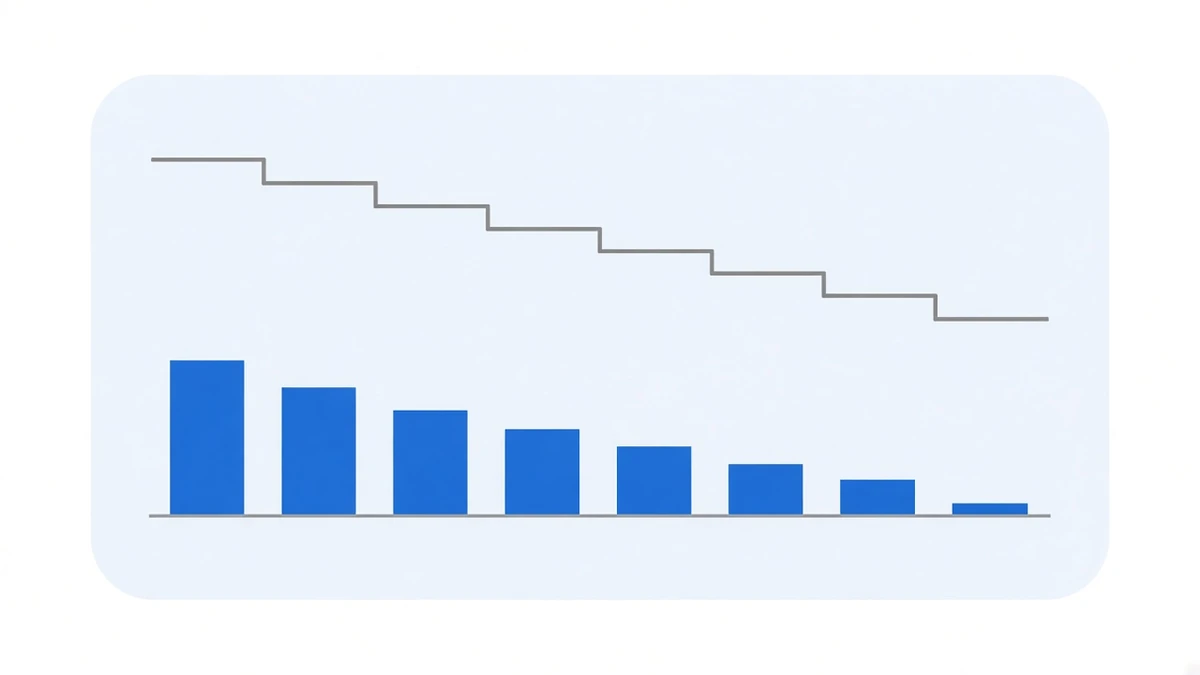
At 9:45am ET on 23 September, S&P Global released the September flash PMI for the US: composite 58.4 (previous 56.0), services 58.7 (previous 56.5), manufacturing 57.0 (previous 53.9). The input-costs component rose to 66.4, the highest since October 2022.
Treasuries sold off hard. The ten-year yield broke above 5.10%, though the three readings we found do not agree — Reuters recorded a 13.89 basis point rise to 5.106%, Newsquawk’s settlement note has +15.3 basis points to 5.108%, and Gate cited +14.70 basis points to 5.114%. We list all three rather than averaging them; what all three agree on is that this is the highest since 2007. The five-year yield reached 5.033% the same day, above 5% for the first time since 2006, and that afternoon’s five-year auction drew a bid-to-cover of just 2.21, the weakest since 2018.
Crypto’s response landed on the long side. On CoinGlass numbers, roughly $444m of longs were liquidated in the 24 hours to 5:14pm ET Wednesday, the most since 15 September; of roughly $580m liquidated market-wide that day, longs were about 77%. Around $380m of it clustered between 5:00 and 13:00, overlapping the PMI release window.
The price prints disagree too: Gate has $84,340 (−2.2% on the day), KuCoin has $84,425 (−2.06%). The mark price on the 2026-09-24 00:00 UTC settlement in our database is 84,355.10.
What funding actually did
BTCUSDT settlement by settlement over those days (all UTC, eight-hour cadence):
| Settlement | Period rate | Mark price |
|---|---|---|
| 09-22 08:00 | 0.010000% | 85,324.70 |
| 09-22 16:00 | 0.002784% | 86,367.50 |
| 09-23 00:00 | 0.001021% | 86,161.48 |
| 09-23 08:00 | 0.000334% | 86,100.00 |
| 09-23 16:00 | 0.001286% | 83,965.70 |
| 09-24 00:00 | 0.000132% | 84,355.10 |
From the clamp ceiling of 0.010000% down to 0.000132%, and not one period turned negative. Those six settlements sum to +0.015557%.
But do not read did not go negative as nothing happened. 0.000132% annualises to 0.14%. BTC’s 799 periods this year have a median of 0.003254% and a mean of 0.002681%; this print sits in the lowest 27.66% of the year. It did not cross zero, but it is resting on it.
Four majors, four different answers
The same move produced four different responses:
| Contract | 09-23 16:00 | 09-24 00:00 | How to read it |
|---|---|---|---|
| BTCUSDT | 0.001286% | 0.000132% | resting on zero, never crossed |
| ETHUSDT | 0.004502% | 0.005263% | barely moved, still near the default |
| SOLUSDT | −0.006733% | 0.001129% | the only major to go negative, back the next period |
| BNBUSDT | 0.000000% | 0.000000% | exactly zero — but that is normal, not a signal |
That last row needs spelling out or it will be misread: 426 of BNB’s 799 periods this year — 53.32% — have been exactly 0.000000%. Three zeros in a row has nothing to do with this drawdown; that is simply what it does. The background is in 233 of Binance’s 908 contracts carry a zero baseline rate.
Market-wide, this was not a funding event at all
Widen from four majors to the whole board and the conclusion gets boring:
| Settlement | Contracts | Negative | Share negative | Median |
|---|---|---|---|---|
| 09-23 16:00 | 447 | 52 | 11.63% | 0.005000% |
| 09-24 00:00 | 447 | 60 | 13.42% | 0.005000% |
The median did not move at all — 0.005000% at both settlements, which is the default value. Eight more contracts went negative. What collapsed was confined to the deepest, most arbitraged names; the long tail of small contracts did not participate. Where any given reading sits in the distribution is in what counts as a high funding rate.
What it means for a matched book
A matched book does not care how far the price fell. It cares whether funding went negative. This time: BTC no, ETH no, BNB no, SOL for one period.
That SOL period was −0.006733%, meaning whoever held the short paid out 0.006733 of a basis point on notional for that period and collected again at the next one. The price fell a couple of percent, longs lost four hundred million, and a matched book saw one line on its statement. That is what delta neutrality does — it is not risk-free, it only removes the price-direction term. Why funding and price are different mechanisms is in when the price crashes, does funding disappear with it.
To be clear about the other side: funding drifting to zero or turning negative in flat and bear markets is something this strategy genuinely runs into — the 2022 row in the performance table is exactly that, and we have not hidden it. The year-by-year numbers are on performance. It did not turn negative this time; that does not mean it will not next time.
What to watch next
Three observable things, none of them forecasts:
- Whether BTC strings together consecutive negative periods. A single negative print is unremarkable — there have been 209 this year. A run is the signal.
- Whether any contract gets switched to hourly settlement. When the exchange reaches for that lever, the basis has already gone out of control.
- Whether the market-wide median leaves 0.005000%. If it moves, that is a genuine market-wide event. Across these two settlements it did not.
Sources: PMI figures are S&P Global’s September US flash release of 2026-09-23 (composite 58.4 / services 58.7 / manufacturing 57.0 / input costs 66.4), cross-checked against Reuters and Newsquawk. Treasury yields are 2026-09-23 close: Reuters 5.106%, Newsquawk 5.108%, Gate 5.114% — the three disagree and all are listed rather than averaged. Liquidation figures are CoinGlass data for the 24 hours to 2026-09-23 17:14 ET. BTC price prints are Gate $84,340 and KuCoin $84,425, each as of their own publication time. Per-settlement funding rates and mark prices come from our own collection database (sourced from Binance’s public USD-M endpoints), latest period 2026-09-24 00:00 UTC; year-to-date window 2026-01-01 00:00 UTC to 2026-09-24 03:00 UTC, cumulative figures are sums of periods, not compounded. Market-wide counts cover the 447 contracts that actually settled at those timestamps. The yearly performance snapshot is dated 2026-08-25 13:42 UTC. Contract tickers are shown to document the data, not as recommendations. Past data does not indicate future returns.