
“Bitcoin just fell through the floor — is your yield gone too?”
Every drawdown brings this question. It deserves a longer answer than “no”, because the honest version is: these two things are not mechanically connected, but the strategy does have its own kind of bad weather — and it looks nothing like a price crash.
What actually sets the funding rate
Perpetual futures have no expiry. With no expiry there is no natural force pulling the contract price back to spot, so exchanges built one: a payment made at each settlement, from longs to shorts when the contract trades above spot, and from shorts to longs when it trades below. Most pairs settle on an eight-hour cycle; Binance has moved a batch to four hours and a few to one.
The load-bearing detail is that funding is set by the basis, not by the direction of price.
Those two get conflated constantly. When price falls, funding only turns negative if the contract falls faster than spot — that is, if the basis inverts. If the contract and spot fall together and the gap between them holds, funding does not move at all. And in the other direction: during a flat, boring market, as long as leveraged longs are still paying up for exposure, funding stays positive while price does nothing.
So “down 30%” and “funding turned negative” are statements about different quantities. The first describes the absolute level of price. The second describes the sign of the contract’s premium over spot.
29 August 2026 is a clean sample
That day Bitcoin fell from 81,479 dollars through 78,000, touching an intraday low of 76,845.71. Futures liquidations over 24 hours came to 82.54 million dollars, 87.6% of it on the long side.
Funding across the same window: 0.0086% per 8 hours for the current period, a seven-day mean of 0.0065%, and 21 consecutive positive settlements inside the measured range.
Price fell nearly 6%. Funding did not miss a single period.
That is not luck, it is the mechanism above doing what it does. What got liquidated was leveraged long positions. The positions that remained were still willing to pay a premium for long exposure — and funding prices that willingness, not the price chart.
What genuinely does thin funding out
Three conditions. All three have left marks on the performance table.
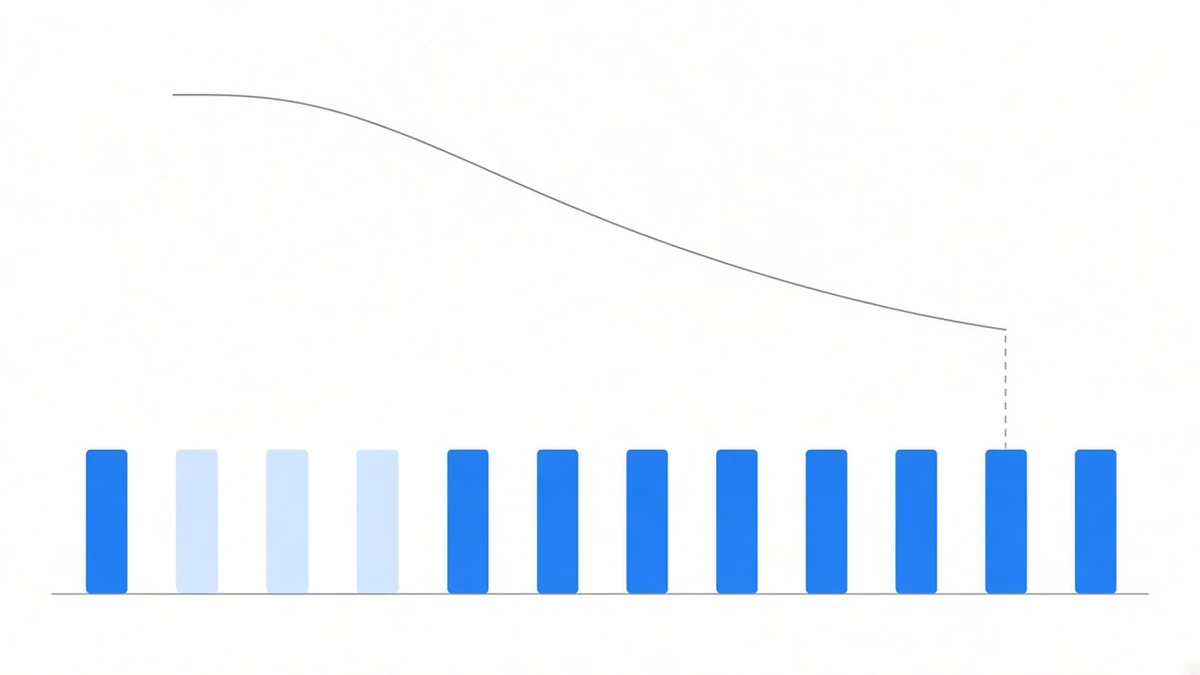
One: a long flat market. Nobody is in a hurry to be long, the premium grinds down, and funding approaches zero. Returns do not go negative — they go thin. This is the hardest regime for a strategy that lives on funding, precisely because it produces no dramatic signal. Nothing breaks. The amount arriving each period simply gets smaller, and it keeps doing that for months.
Two: sustained negative funding in a deep bear market. Shorts crowd in, the contract trades at a discount, and a long-spot / short-perp position starts paying out instead of collecting. 2022 was this: ETHUSDT returned 7.873% amplified for the entire year, and that is where the number comes from. Whether the structure can simply be run in reverse when the sign flips is negative funding rates.
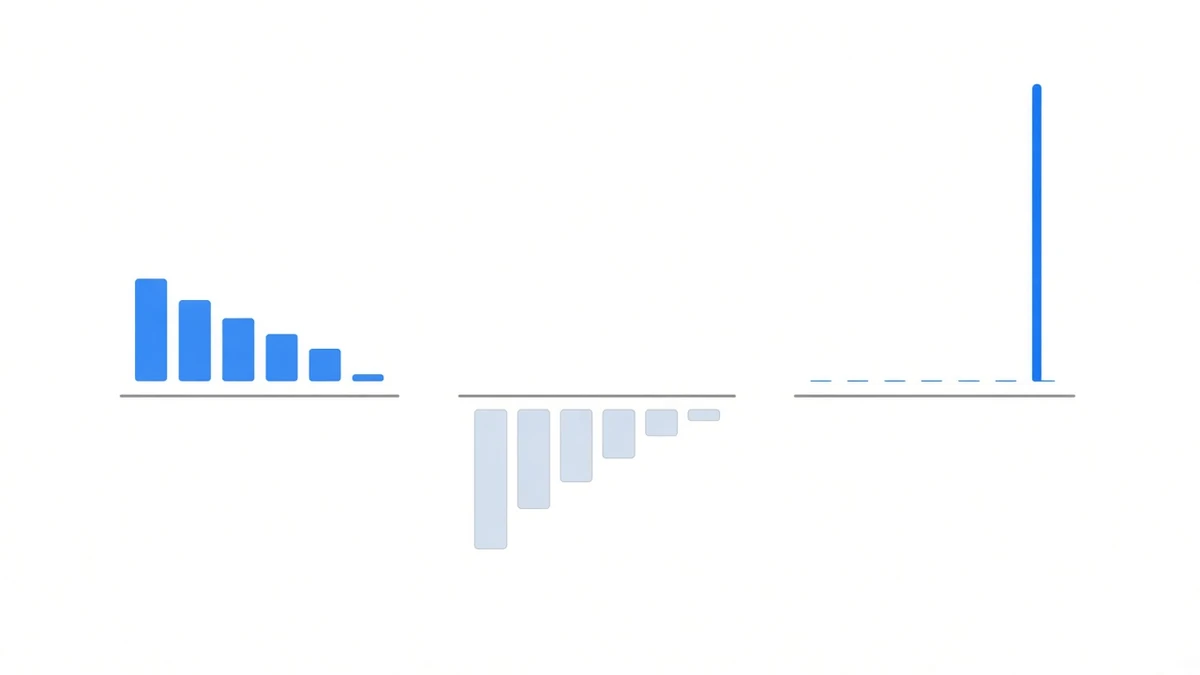
Three: a one-sided stampede. Funding spikes hard in either direction over a few hours. The real risk in those moments is not the rate — it is liquidity, specifically whether both legs can be closed at the same time. A hedge you cannot exit as a pair is not a hedge for the duration of the exit.
How to tell which regime you are in
Three numbers together, rather than watching price:
| What to look at | What it tells you |
|---|---|
| Sign and magnitude of funding | Whether the source of return is still there, and how thick it is |
| Direction of open interest | Price rising with OI expanding, versus price flat while leverage quietly stacks up, are two different markets |
| Distance to the crowding line | Around 0.03% per 8 hours usually means longs are over-crowded, and crowded books get cleared out |
The year-by-year funding record, worst year included, is on the performance page, and the market-wide statistics behind it come from the same settlement-level data. The gap between the best cell and the worst — 375.621% against 7.873% — is worth reading on its own, in the six-year review. What a selloff should actually make you check is not whether funding vanished but which risks the strategy never removed. Reading those once is worth more than reading ten headlines about a single day.