The Federal Reserve voted 12–0 on 16 September 2026 to raise the federal funds target range by 25 basis points to 3.75%–4.00%, effective 17 September. The Board separately voted unanimously to lift the interest rate on reserve balances to 3.90% and the primary credit rate to 4.00%. The statement’s wording: “Inflation remains elevated.”
Crypto’s reaction was calmer than expected. BTC slipped just under $76,000 on the decision, then recovered, touching $77,000 intraday on Thursday. The interesting part is not the price. It is which side got cleared out.
In two days, the liquidated side flipped from longs to shorts
Last week, when the CLARITY Act stalled in the Senate, the side being liquidated was longs. This time it reversed.
The specific numbers disagree across sources, so we are printing the disagreement rather than splitting the difference:
| Source | 24h liquidations | Shorts | Longs |
|---|---|---|---|
| CoinGlass (via Lumida) | $345M | $208M | $137M |
| news.bitcoin.com own tally | ~$398M | ~$260M | ~$138M |
The two totals differ by more than fifty million dollars — different windows, different data sources — but they agree on direction: materially more shorts were liquidated than longs. On the CoinGlass figures, 86,816 traders were closed out, with ETH around $89M, BTC $85M and ZEC $56M.
Ordinarily a short squeeze of that size reignites long demand and pushes funding up. It did not.
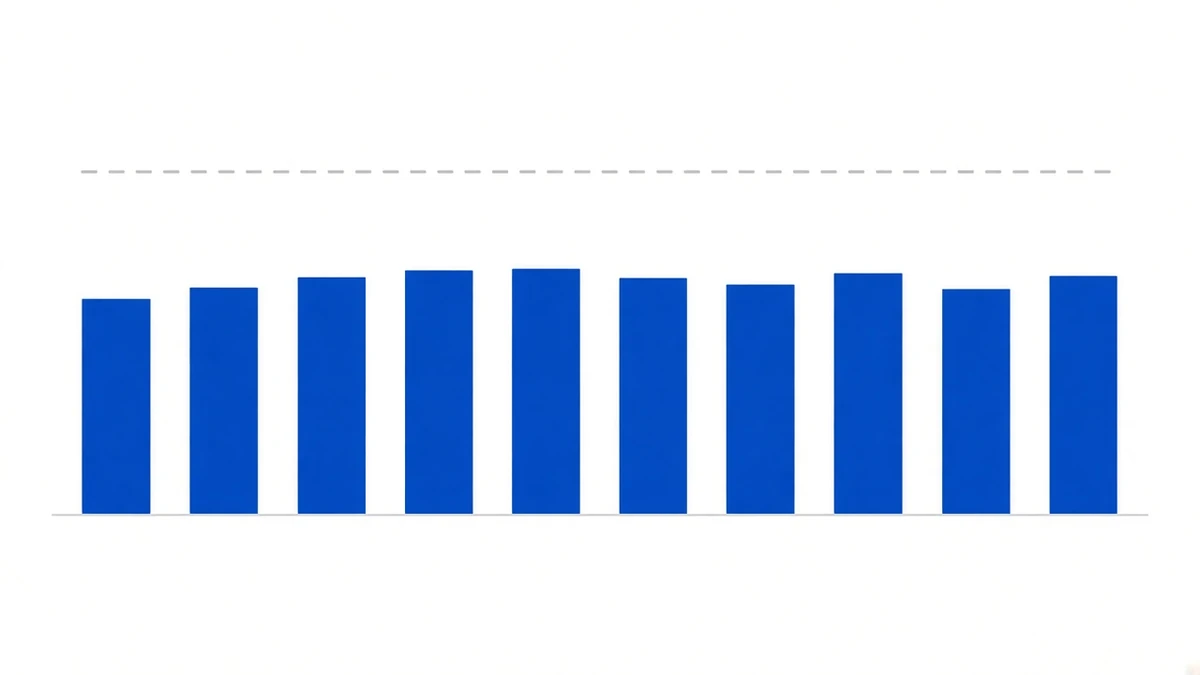
Funding: all ten periods positive, none above 0.01%
We re-pulled the per-period settlements for the event window (2026-09-15 00:00 to 09-18 00:00 UTC, ten periods) from Binance’s public futures API. A note on provenance: our on-site snapshot stops at 2026-08-25, so this round is not in it — the figures below were fetched live.
BTCUSDT, all ten positive, 0.060495% cumulative:
| Settlement (UTC) | Rate |
|---|---|
| 09-15 16:00 | 0.009812% (window high) |
| 09-17 00:00 | 0.009351% |
| 09-17 16:00 | 0.008505% |
| 09-18 00:00 | 0.007769% |
| 09-16 08:00 | 0.002788% (window low) |
The highest period did not even reach 0.01%. For comparison, Binance BTCUSDT’s 30-day average this year is 0.006816% per period — so this round ran barely above normal, nowhere near what a squeeze-driven spike would look like.
ETH went the other way, which is the more interesting part
Over that same ten-period window, ETHUSDT printed four negative periods, totalling just 0.001313%:
- 09-15 08:00: −0.008189%
- 09-15 16:00: −0.004838%
- 09-16 00:00: −0.000327%
- 09-16 08:00: −0.004012%
SOLUSDT also had four negative periods in the window. In other words, during the same stretch in which shorts were being liquidated en masse, ETH and SOL shorts were being paid for four of those periods.
The two facts are not contradictory, but together they say something: the accounts being force-closed were the highly leveraged directional ones, and once they were gone, no cohort of longs stepped in willing to pay higher rent. Positions being cleared and demand returning are different events.
What it means for a balanced two-leg position
Plainly: nothing in this round required any action.
A spot-long plus contract-short position does not care whether BTC is at 75,000 or 77,000. It cares about one thing: whether funding turned negative. BTC did not turn negative in any of these ten periods, and neither did BNB (0.041943% cumulative over the same window).
Liquidation data does not enter our model. It is relevant in one way only: mass forced closure drains liquidity momentarily, and that is the worst possible environment for getting two legs down at the same time. That is execution risk rather than funding risk, and we wrote about it in what makes delta-neutral hard to run.
The thing actually worth worrying about
The Fed put short-term rates at 3.75%–4.00%.
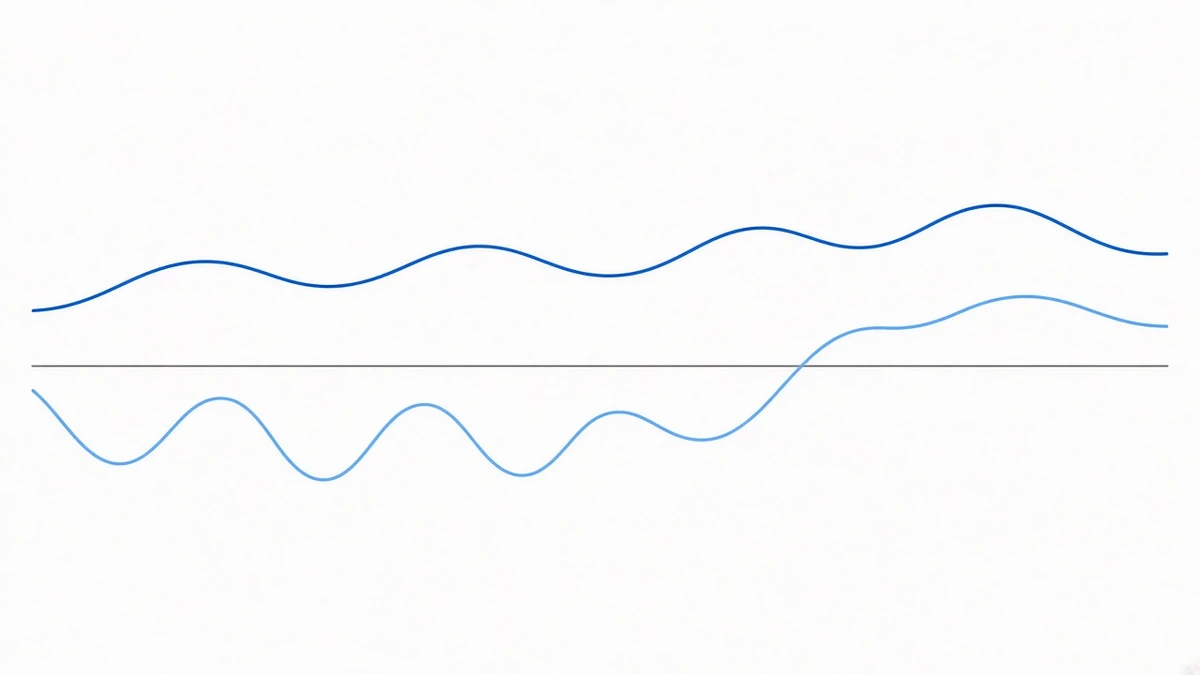
Binance BTCUSDT’s 781 periods this year total 2.030026%, which across 260 days is 2.85% annualised. ETHUSDT is at 1.70%.
That is the genuinely unfavourable news of the week for funding arbitrage: not that funding turned negative, but that it cannot keep up with a deposit account — and the deposit account just got 25 basis points better. And that is the gross figure, before trading costs.
What to watch
No forecasts, three observables:
- Whether ETH turns negative again. September’s 52 periods so far show 8 negative for ETH and 22 for SOL against 1 for BTC. The turn always seeps down from those two.
- Average per period, not single-period peaks. BTC’s 30-day average is 0.006816%. When magnitude collapses, that number moves first.
- Whether another hike lands before year-end. Several outlets reported policymakers signalling one more this year. Every notch higher in the risk-free rate is a notch off this leg’s appeal.
Funding thinning toward zero or turning negative in flat and bear markets is something this approach genuinely runs into — ETHUSDT’s 0.787% line for 2022 on our track record page is exactly that. Funding did not turn negative this time. That does not mean it will not next time.
Sources: the rate decision and implementation details come from the Federal Reserve’s own releases — the FOMC statement of 16 September 2026 and the implementation note; the two liquidation tallies come from CoinGlass (via Lumida) and news.bitcoin.com, both 24-hour windows on 17 September with different start and end points; BTC price via Forbes citing CoinGecko; per-period funding from Binance’s public futures API (read at 2026-09-18 07:13 UTC, latest settlement 2026-09-18 00:00 UTC); yearly totals on our track record page, on-site snapshot timestamp 2026-08-25 13:42 UTC.