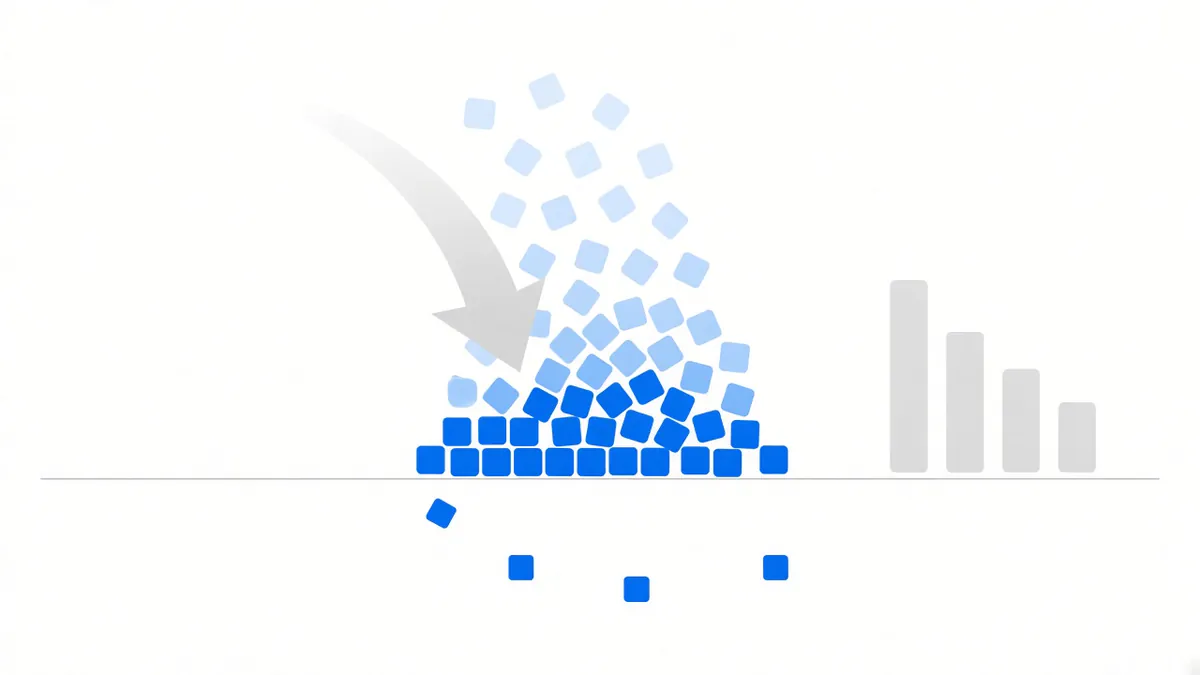
On 16 September 2026 the Clarity Act failed to clear the US Senate’s 60-vote procedural threshold. For several days beforehand the market had been priced for the bill advancing — bitcoin rose from about $77,000 on Monday to nearly $80,000. After the vote it pulled back; CoinDesk had it around $75,700 at the time of writing, still inside its recent range.
What is worth looking at is not the price. It is which side got cleared out.
The liquidations were almost entirely one-sided
According to CoinGlass data, as reported by CoinDesk, over that 24-hour window:
| Item | Amount |
|---|---|
| Long liquidations, total | about $571 million |
| Short liquidations, total | about $100 million |
| BTC longs | about $190 million |
| ETH longs | about $190 million |
| XRP longs | about $30 million |
| SOL longs | about $22 million |
Longs accounted for more than eighty percent of the total, and this was the largest single flush of longs since 22 August.
Another set of numbers shows leverage is still dense: as of 2026-09-17 02:30, CoinGlass liquidation-intensity data indicated that a break below $72,225 would bring cumulative long liquidation intensity on major exchanges to roughly $1.88 billion, while a break above $79,701 would bring cumulative short liquidation intensity to roughly $1.646 billion.
What fell was not demand, it was leverage. Spot does not get liquidated; everything that did was a leveraged directional position.
Why this is relevant news for funding rate arbitrage
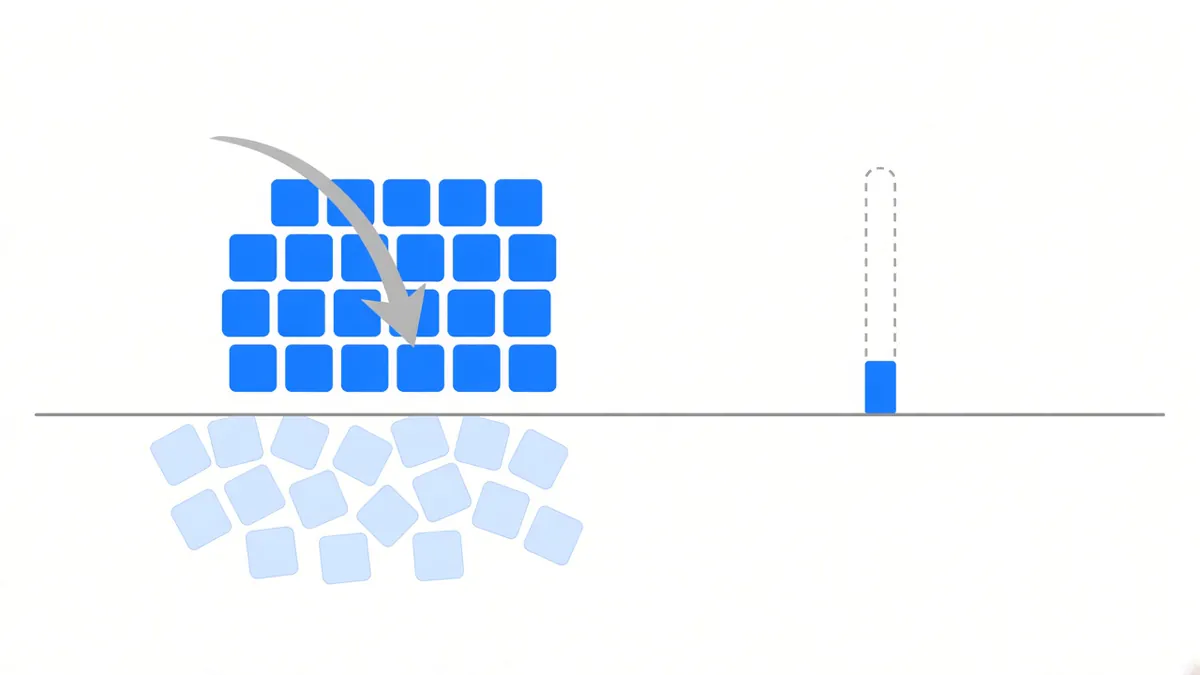
When funding is positive, the side paying is the longs. The contract trades above spot, longs pay shorts each period, and that payment is the entire return source for a notionally balanced two-leg position (what a funding rate is).
So a flush dominated by longs clears out the side that pays. That is not a figure of speech: once leveraged longs are liquidated, the bid structure on the contract side is reset, basis narrows, and funding thins with it.
Two things that get conflated have to be separated here:
- A falling price does not mean funding turns negative. Funding is set by basis, not by direction. When the price crashes, does funding go with it used the 29 August 2026 drop as a sample: the price fell nearly 6% over three days and all 21 periods of funding stayed positive.
- Leveraged longs being cleared out does thin funding. This is the actual transmission path, and it has nothing to do with price direction and everything to do with whether anyone is still in a hurry to be long.
What we can offer here, and what we cannot
The part we cannot: our backend period-by-period settlement snapshot is dated 2026-08-25 13:42 UTC, three weeks before this event, so the period readings after this flush will have to wait for the next snapshot. They are not available now. No way around that.
What we can offer is a historical reference. What a year with leveraged longs absent for a long stretch looks like is already in the table (raw funding, periods summed):
| Year | BTCUSDT | ETHUSDT |
|---|---|---|
| 2021 | 30.635167% | 37.562125% |
| 2022 | 4.164925% | 0.787256% |
ETH’s raw funding for all of 2022 was 0.787%, or 7.873% with principal scaled ten times on an interest-free basis. That year was not caused by one day of collapse; it was longs not being in a hurry for twelve straight months. This is a condition the strategy genuinely runs into, and we keep that cell next to the 2021 high on the performance page rather than somewhere else.
For contrast, BTC’s 711-period total this year to the snapshot was 1.589788% — this was never a rich year for funding to begin with.
What it means for a balanced position
A notionally balanced two-leg position cares about exactly one thing: whether funding turned negative. The move from 80,000 down to 75,700 nets out between the two legs and produces no P&L.
The liquidation wave does not hit this kind of structure directly either — what gets liquidated are one-sided directional positions short of margin, and a balanced position has zero directional exposure. The only line worth watching is funding.
Honestly stated: whether funding turns negative after this event is something we have no data to answer right now. The next snapshot will give the reading.
What to watch next
No forecasts. Three observable indicators:
- Whether open interest comes back. After leveraged longs are cleared, a recovery in OI is what says the paying side is returning.
- The count of positive funding periods, not the level of funding. How many of the three daily periods print positive says more about structure than any single reading.
- How long until the next flush on the scale of 22 August. Clustered occurrences mean leverage is being rebuilt and cleared repeatedly, which is the least stable state funding can be in.
In flat and bear markets funding drifts toward zero and can turn negative — that is a condition this strategy genuinely runs into, and the 2022 row in the performance table is how it happened. We have not hidden it. It did not happen this time, which does not mean it will not happen next time.
Sources: liquidation amounts, the per-asset breakdown and “largest since 22 August” come from CoinGlass data as reported by CoinDesk on 2026-09-16 (coindesk.com/markets/2026/09/16/crypto-bulls-take-a-usd570-million-liquidation-hit-as-clarity-act-fails); liquidation-intensity thresholds come from CoinGlass as relayed by ChainCatcher at 2026-09-17 02:30; the price is CoinDesk’s reading at time of writing. Our own funding figures come from the backend period-by-period snapshot, as of 2026-08-25 13:42 UTC, periods summed. Past data does not indicate future returns.