The US 10-year Treasury yield touched 5.041% intraday on 15 September, its highest since 2007. The Treasury’s official close the day before was 4.97%, one basis point under the 4.98% print of 19 October 2023; the last close at or above 5% was 19 July 2007. Brent crude ran to $108.06 the same morning, and the FOMC’s 15–16 September meeting was under way.
Crypto went with it. On Binance, the BTCUSDT perpetual traded as low as $75,560.00 over 24 hours — the lowest print of September — against a high of $79,570.90, last at $76,365.70, down 2.83%. ETHUSDT bottomed at $2,388.00, down 3.91% (read at 2026-09-15 16:37 UTC from Binance’s public futures endpoints).
“ETF outflows continue” stopped being true on the 14th
Plenty of coverage pinned this leg down on consecutive spot-ETF outflows. That part checks out: in Farside’s daily series, 8–11 September were four straight sessions of net outflows — $46.6M, $120.2M, $282.7M and $13.2M, $462.7M in all.
But 14 September already flipped back to a net inflow of $159.9M, and the 15th has not printed yet. The streak broke on the 14th. Most of the copy filed on the 15th simply had not refreshed that cell.
Funding is still positive. It is also no longer worth much.
The near-term readings look fine:
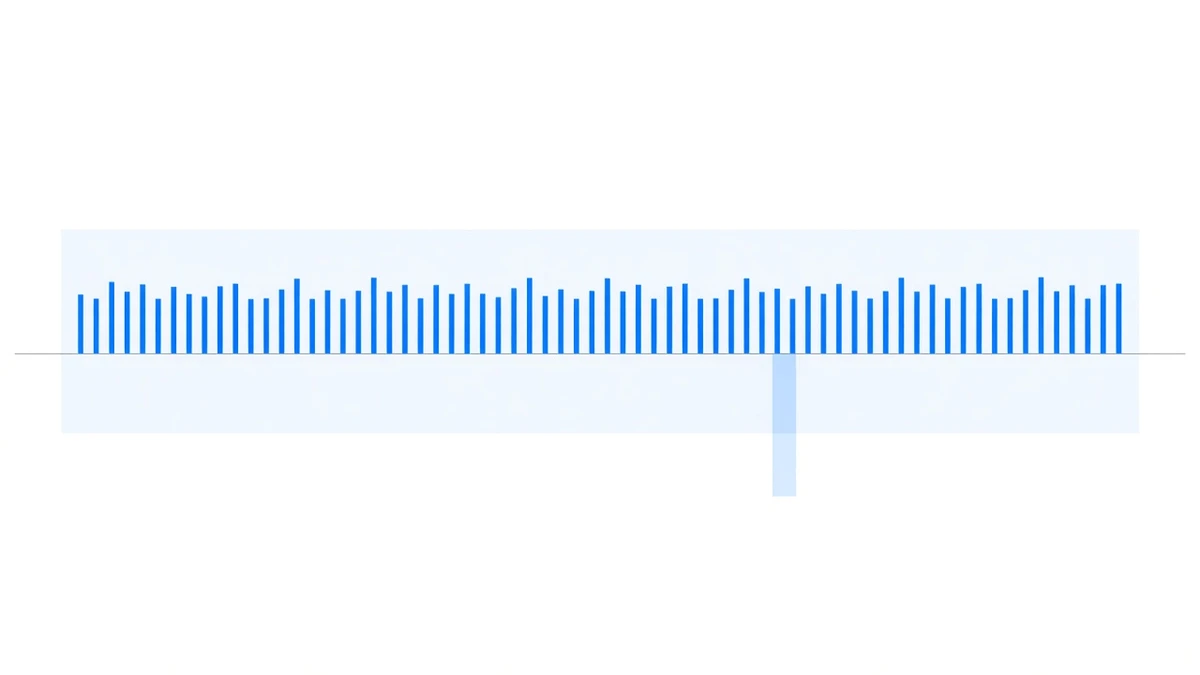
- BTCUSDT, most recent settled period (2026-09-15 16:00 UTC): 0.009812% / 8 hours
- Last 7 days: 21 periods, mean 0.005774%, range 0.003006% – 0.009812%, 21 of 21 positive
- Last 30 days: 89 of 90 periods positive, 0.608146% in total
Taken on their own, those lines read like late August all over again: price broke, funding held. Widen the window to the start of the year and they stop reading that way.
- BTCUSDT year to date: 774 periods, 1.989094% in total across 257.67 days — 2.82% annualised
- 209 of those 774 periods were negative; 565 positive, or 73.0%
- ETHUSDT year to date: 774 periods, 1.195553%, 1.69% annualised; its most recent settled period came in at −0.004838%
These are recomputed from Binance’s period-by-period history rather than copied off the snapshot on this site, and the two agree. The snapshot stops at 2026-08-25 13:42 UTC with BTCUSDT at 1.589788% for the year. Spread the extra 0.399306% over the 63 periods in the 21 days since and you get roughly 0.00634% per period — right about where the 30-day mean of 0.006757% sits.
Put it next to 5%
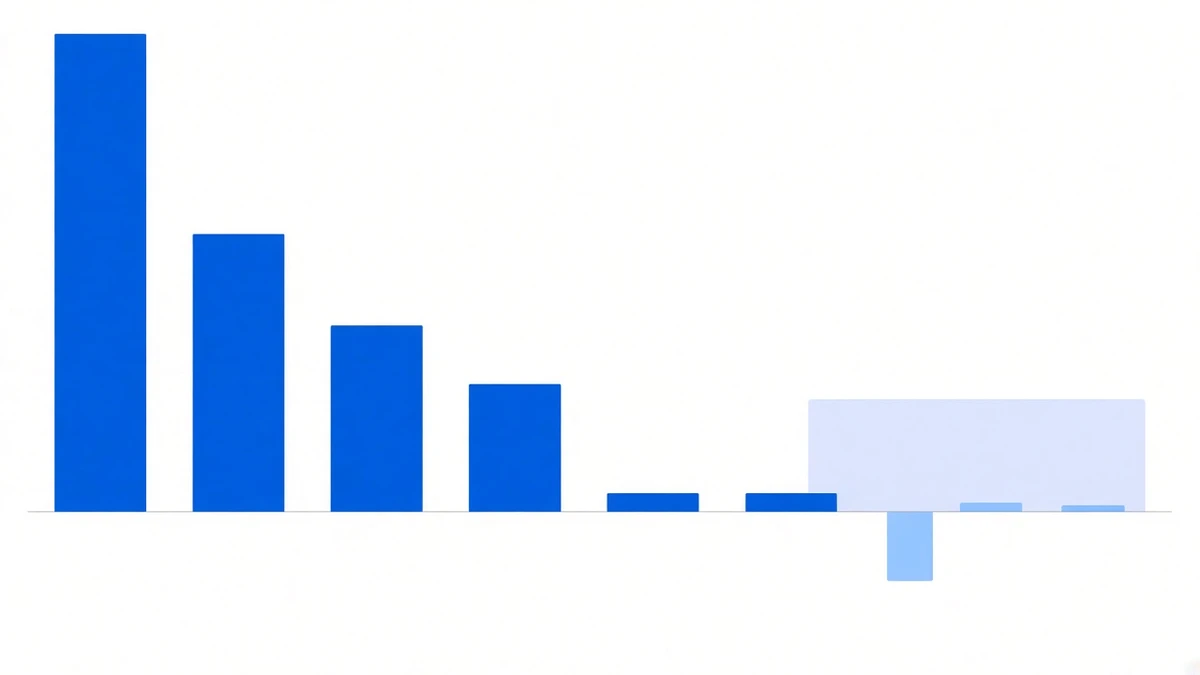
A position with matched notional on both legs earns funding and nothing else. So the benchmark is not complicated: it is whatever holding dollars pays.
| Annualised | |
|---|---|
| US 10-year (15 Sep, intraday) | 5.041% |
| US 10-year (14 Sep, official close) | 4.97% |
| Fed funds target range, lower bound | 3.50% |
| BTCUSDT funding (year to date) | 2.82% |
| ETHUSDT funding (year to date) | 1.69% |
So far this year, the funding leg has underperformed the short-term risk-free rate. Not narrowly — 3.50% against 2.82%, and that figure is gross, before trading costs. One note on scope: this compares funding income alone. Carrying the spot leg and rebalancing both legs cost something, and folding those in makes the picture worse, not better.
None of this happened in a day. The performance page has had it in plain view: BTCUSDT funding totalled 30.635% in 2021, 11.980% in 2024, 5.133% in 2025, and 1.590% through 25 August 2026. ETHUSDT fell off harder — 37.562% in 2021, 0.787% in 2022.
That 0.787% for ETHUSDT in 2022 has always been in the table. It was never hidden. The current row looks like it is heading the same way.
What to watch
No forecasts — three things you can count for yourself:
- The share of periods that print positive. 89 of 90 over 30 days, 565 of 774 year to date. If that share falls below seven in ten, negative periods are getting denser rather than merely shallower.
- ETH moves first. ETHUSDT’s most recent settled period is already negative, and it has had 6 negative periods in September, the deepest at −0.01081%. BTCUSDT has had 1, at −0.00015%.
- The spread itself. A 10-year near 5% against funding annualising under 3% either closes because leverage demand comes back, or it stays where it is.
The third one is worth saying plainly: if funding annualises below the short rate for long enough, funding-rate arbitrage stops being worth doing — that is not an execution problem, it is the market declining to pay a premium this period. Funding drifting toward zero, or turning negative, in flat and bear markets is something this strategy genuinely runs into. This time the size collapsed before the sign did.
Sources: Binance public futures endpoints (period-by-period funding history, mark price, 24-hour ticker; read at 2026-09-15 16:37 UTC, most recent settlement 2026-09-15 16:00 UTC); the 10-year yield and the “highest since 2007” framing from Bloomberg and CNBC market data, with official closes taken from the US Treasury daily yield curve; ETF flows from Farside Investors, through 14 September 2026; in-house figures per the funding rate history and performance pages, snapshot 2026-08-25 13:42 UTC.