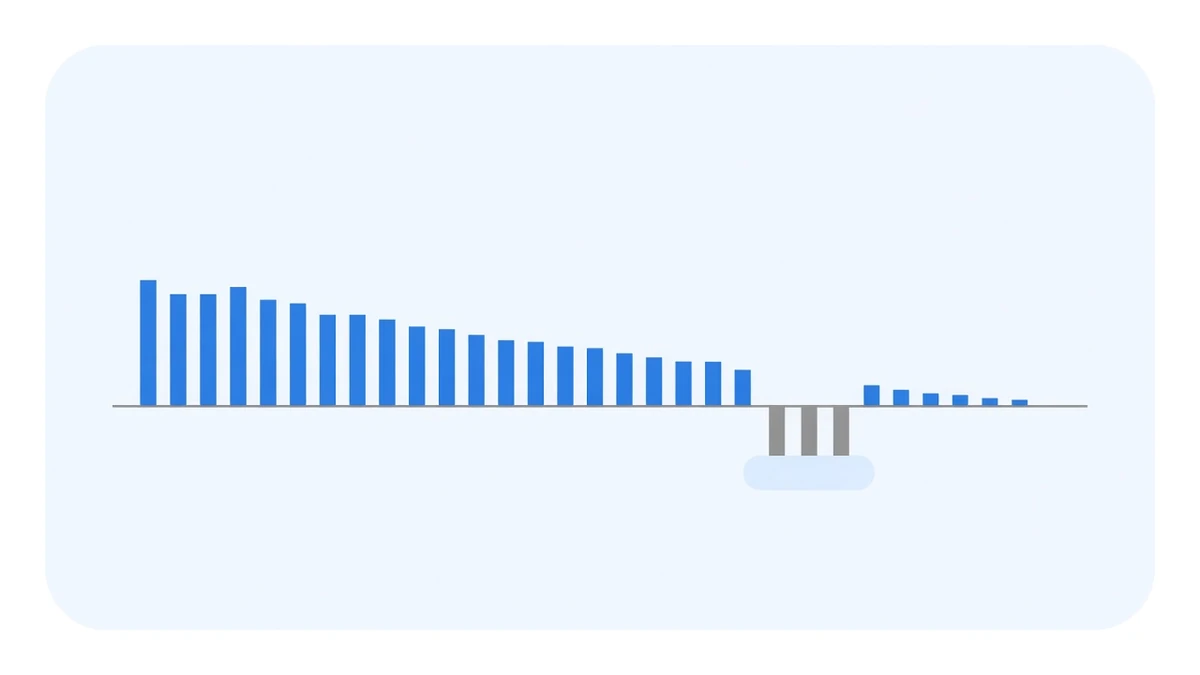
If you are looking up USDe’s yield, you probably want to know two things: who pays it, and whether it can fall to zero or below.
The short answer first. According to Ethena’s own documentation, protocol revenue now comes from four sources: funding and basis spread, lending revenue, real-world asset yield, and rewards on liquid stablecoins (Protocol Revenue). The first of those is the same money funding rate arbitrage collects: a spot long paired with an equal perpetual short, so that price moves cancel out and what remains is the funding that longs pay shorts at every settlement.
That leg can be rebuilt period by period. Taking Binance’s BTCUSDT and ETHUSDT half each and summing every settlement gives an illustrative version of the funding leg:
- 2024: 12.50%
- 2025: 5.03%
- 2026 to 27 September: 1.77%, with February, March and April all negative
This is not USDe’s or sUSDe’s actual yield, and the sections below spell out why. What it does show is how much the longest-standing source of Ethena’s yield has paid this year.
How Ethena describes that revenue
Four points, all from Ethena’s documentation as read on 27 September 2026:
- Revenue has four sources, diversified on purpose. The stated aim is to diversify revenue and risk, because a model concentrated in one strategy ties overall risk to a single set of market dynamics (Protocol Revenue).
- Negative revenue is not passed on to sUSDe. sUSDe can only accrue positive or flat rewards; in periods of negative protocol revenue no rewards are distributed, and losses are meant to be borne by the Reserve Fund (Rewards Mechanism).
- Allocation shifts when funding is low or negative. More of the backing moves into liquid stablecoins earning roughly the US Treasury rate, to reduce exposure to negative funding (Funding Risk).
- The Reserve Fund is not currently topped up from revenue. The share of revenue allocated to it is 0% at present, with 100% going to incentive rewards and distributions; its current size is shown on Ethena’s transparency dashboard (Reserve Fund).
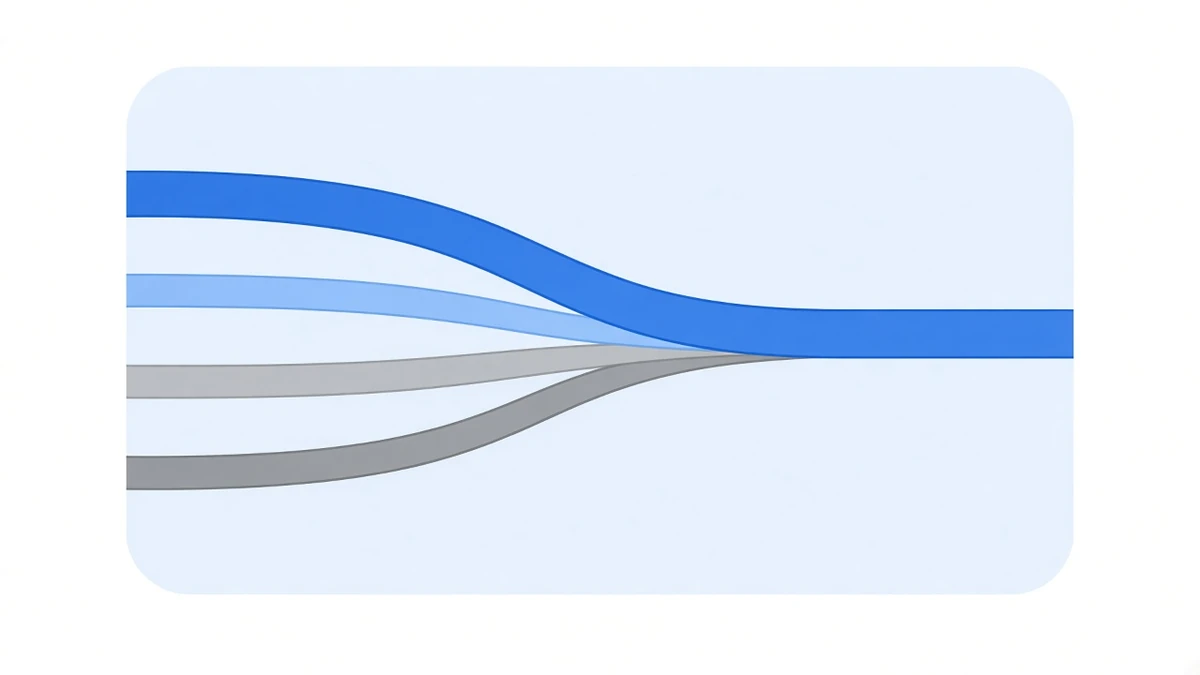
So when you read an sUSDe APY, you are looking at four revenue streams combined, after the Reserve Fund’s backstop. Here is what the funding stream looks like on its own.
The funding leg, year by year
| Year | BTC | ETH | Half each | Negative months |
|---|---|---|---|---|
| 2021 | 30.64% | 37.56% | 34.10% | 0 |
| 2022 | 4.16% | 0.79% | 2.48% | 2 (Sep, Nov) |
| 2023 | 7.84% | 8.24% | 8.04% | 0 |
| 2024 | 11.98% | 13.02% | 12.50% | 0 |
| 2025 | 5.13% | 4.94% | 5.03% | 0 |
| 2026 (to 27 Sep) | 2.16% | 1.39% | 1.77% | 3 (Feb, Mar, Apr) |
Method: sums of periods, not compounded; fees, slippage and spot-side returns excluded. The 2021 to 2025 figures are the same backend snapshot as our performance page; 2026 and the negative-month counts are summed from our collection database.
Ethena’s docs give their own ETH figures on an open-interest-weighted basis: 0.6% in 2022, about 9% in 2023 and about 13% in 2024 (Crypto Basis Trade). Our single-venue Binance sums are 0.79%, 8.24% and 13.02%, so those three years line up. 2021 is the outlier: 16% on their basis against 37.56% on ours. The methods differ (market-wide open-interest weighting against one venue summed period by period), so any figure you quote needs its method attached.
The two ends of the table matter most. 2021 paid 34.10% half-and-half, the year leveraged longs were most crowded; 2022 fell to 2.48% with two negative months. 2023 and 2024 came back to between 8% and 12.5%, 2025 halved to 5.03%, and 2026 has paid 1.77% up to 27 September. Annualised linearly over the 269 days elapsed, that is about 2.41%, the same order as 2022’s 2.48%.
2026 month by month: when the backstop has work to do
| Month | BTC | ETH | Half each |
|---|---|---|---|
| Jan | 0.46% | 0.41% | 0.43% |
| Feb | −0.06% | −0.31% | −0.19% |
| Mar | −0.09% | −0.09% | −0.09% |
| Apr | −0.18% | −0.14% | −0.16% |
| May | 0.23% | 0.29% | 0.26% |
| Jun | 0.20% | 0.05% | 0.13% |
| Jul | 0.57% | 0.35% | 0.46% |
| Aug | 0.62% | 0.48% | 0.55% |
| Sep (to 27th) | 0.42% | 0.34% | 0.38% |
February to April were negative three months running, about −0.43% combined. Across the 81 months from January 2020 to September 2026, only five were negative on this half-and-half basis: September and November 2022, and February, March and April this year. Three consecutive negative months had not happened before in that window. The worst single month is still September 2022, at −0.60%.
For an sUSDe holder, those three months do not show up as negative. The funding loss is first netted against the other three revenue streams; whatever is left, according to the docs, falls to the Reserve Fund, with no rewards distributed and more backing moved into stablecoins. For someone holding both legs in an exchange account, those months were real outflows. The same negative funding produces two different curves depending on how you hold it.
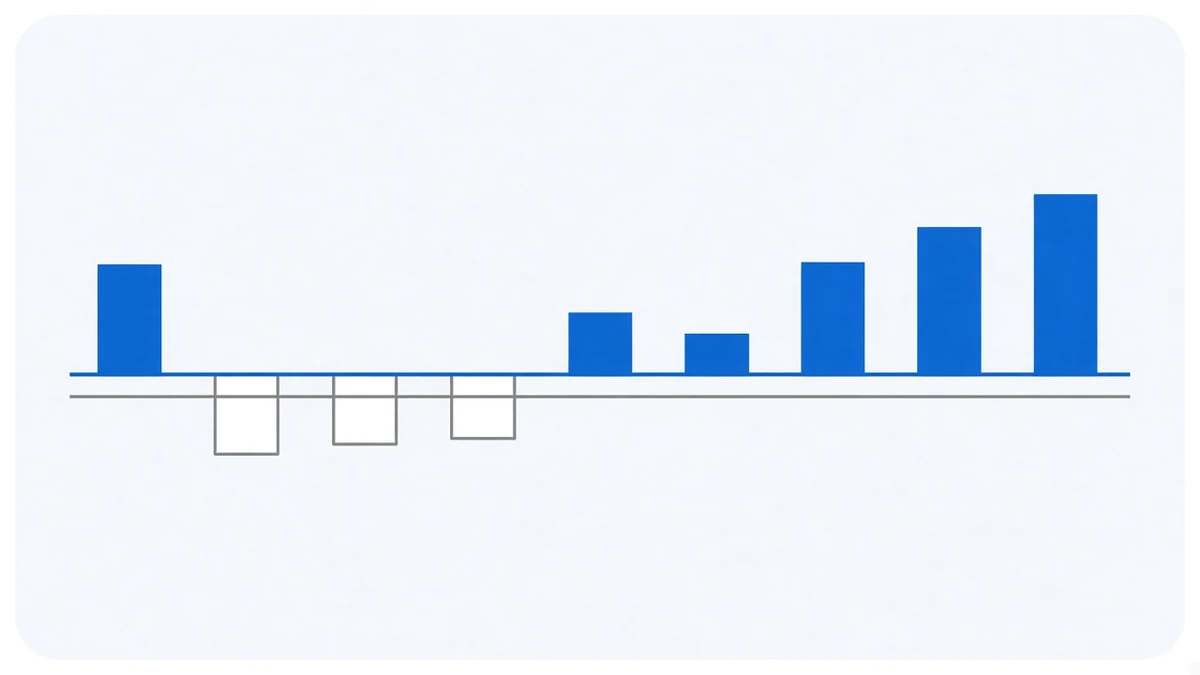
How to read an sUSDe yield history chart
- It is a composite. Four revenue streams are stacked, and the funding stream can be checked against the two tables above. How much yield survives weak funding depends on lending, RWA and stablecoin rewards.
- It lags the funding rate. Per the docs, APY is calculated weekly and rewards are paid out over the following week (Rewards Mechanism). A change in funding shows up in sUSDe rewards about a week later, smoothed across the week.
- It does not go below zero, by design. Negative revenue is absorbed by the Reserve Fund, which is not the same as funding never turning negative. To see what happened underneath, look at per-period data, for example how long funding can stay negative.
The same money, two ways to hold it
The funding income itself does not change with the wrapper. It comes from the premium leveraged longs are willing to pay to hold their positions: more when longs are crowded, less when they retreat, occasionally reversed (why funding is usually positive). What differs is the packaging:
| Holding sUSDe | Holding both legs in an exchange account | |
|---|---|---|
| Income | Funding and basis + lending + RWA + stablecoin rewards | Per-period funding itself |
| Negative periods | Borne by the Reserve Fund; no rewards paid | Borne by you, visible every period |
| What you hold | A token | Spot and futures positions in an account |
| Main risks | Protocol, custody, redemption mechanics and the token’s secondary-market price | Exchange counterparty and execution |
Ethena’s own risk section lists funding, liquidation, custody and exchange-failure risks, among others. For the exchange-account side, where the risk sits and who carries it, see the counterparty arbitrage cannot avoid and our security page. Which suits you depends on which set of risks you would rather carry; this article does not choose for you. How our setup works is on How it works.
Data and method: per-period funding rates come from Binance’s public USD-M endpoint fapi/v1/fundingRate (BTCUSDT, ETHUSDT), via our collection database, 2020-01-01 to 2026-09-27 00:00 UTC. “Half each” is the average of the two contracts’ totals for the month or year, summed per period and not compounded, excluding fees, slippage and spot-side returns. The 2021 to 2025 yearly figures are the same backend snapshot as the performance page (taken 2026-08-25 13:42 UTC); monthly figures are summed from the collection database, and the two may differ by up to 0.03 percentage points because of bucketing. Ethena’s revenue sources, Reserve Fund, sUSDe reward rules and ETH funding figures are quoted from five pages of its official documentation (Protocol Revenue, Reserve Fund, Rewards Mechanism, Funding Risk and Crypto Basis Trade), read on 2026-09-27. “Half each” illustrates the funding leg only; it is not USDe’s or sUSDe’s actual yield. Nothing here is a recommendation of any token or product. Past data does not indicate future returns.