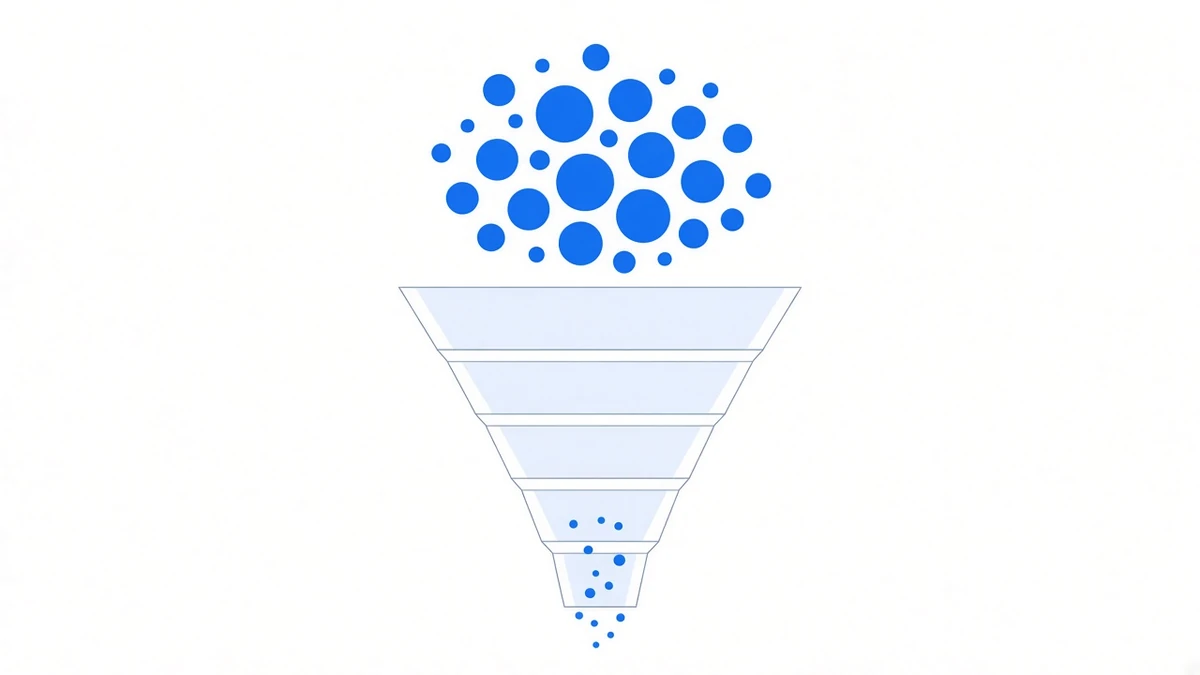
Funding rate arbitrage comes with an assumption most people never state: double the capital, double the return.
At small size that assumption roughly holds. The further up you go, the less it holds — and what you hit first is not the rate. The rate is a market-wide number; it does not change because you wired more money in January. What you hit first are four specific walls. They arrive in a fixed order and each needs a different answer.
This piece puts them in the order they arrive.
Wall one: order book depth — both legs have to land together
This is the earliest one, and it has nothing to do with your total capital. It only cares about the size of a single entry.
Building the position means buying spot and opening a short at the same time, with both sides eating into their own order books. Any single order larger than the layer the book can absorb pushes the price yourself. Slicing into smaller orders reduces the impact, at the cost of stretching the window in which the two legs are out of step.
Those two things are in direct conflict: less slippage requires going slower, and during those slower minutes you are carrying an unbalanced, naked position. Why “at the same time” is the hardest part of the whole exercise is covered in delta-neutral in practice.
What it actually limits: not how much money you can hold, but how fast you can put it in and take it out. More money means longer entry and exit cycles.
Wall two: tiered margin — bigger notional, lower available leverage
Exchange margin requirements on perpetuals are not a constant. They are a table tiered by notional: for the same symbol, moving your position into the next tier lowers the maximum available multiple and raises the maintenance margin rate at the same time.
For a balanced two-leg position that means two things:
- The same margin now supports less notional. Funding is collected on notional, so if notional cannot grow, income cannot grow.
- The distance to liquidation gets shorter. A higher maintenance margin rate means a thinner buffer.
What matters is that both happen together: it is not “put in more money and buy it back.” Each tier up, capital efficiency and safety margin degrade together. Whether the multiple is a yield choice or a liquidation-distance choice is worked through in sizing a delta-neutral position.
The specific tier thresholds differ by symbol and by exchange, and exchanges can change them at any time. In code they should be read from the API, not hard-coded.
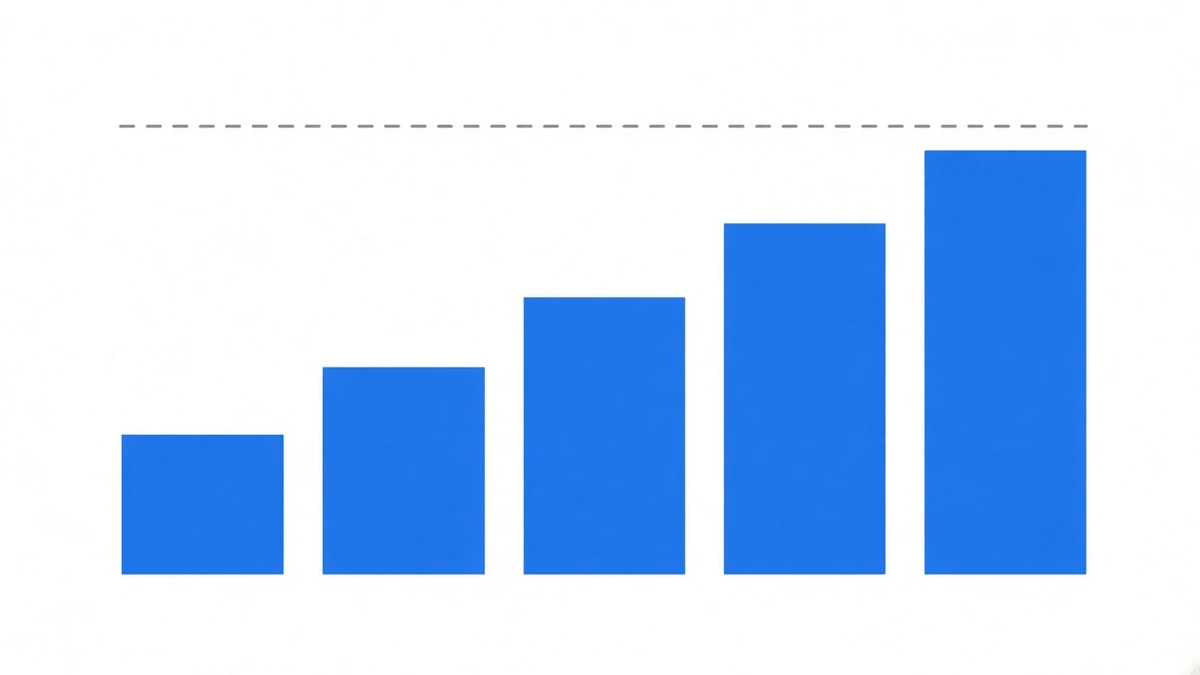
Wall three: there are only so many workable symbols
After hitting the first two walls, the natural move is “spread it across more symbols.” That runs out quickly too.
Symbols with deep enough books, durably positive funding, and contracts that will not simply vanish are countable. Which coins suit funding rate arbitrage works through four majors period by period. Move down into mid and small caps and three problems arrive together: thin books, jumpy funding, and contracts that can be delisted.
Delisting is worse than it sounds. When a contract is delisted the position is closed on the exchange’s own terms, and your spot leg does not move with it — from that second you are naked. The same contract was delisted across four venues 23 days apart with three different settlement conventions; we wrote that one up separately.
What it actually limits: the number of usable symbols is finite, and every extra symbol adds another share of entry, reconciliation and monitoring work.
Wall four: at enough size, you are the short
This one gets mentioned least and is the hardest to route around.
Funding grows out of the gap between the contract and spot. The act of opening your short pushes the contract price down, which is to say it pushes down the very rate you are trying to collect. At small size the effect is negligible. At large size it is not.
Set the scale first. Per CoinGlass (2026-09-18, via ChainCatcher), total BTC futures open interest was about $56.069 billion, of which Binance held $11.946B, Gate $5.426B, Bybit $5.367B and OKX $3.015B.
Use that as a reference: a $10 million short sitting inside Binance’s $11.946B of open interest is about 0.08% — a size at which you are not meaningfully pressing on yourself. But each order of magnitude up moves that ratio from “ignorable” to “has to be counted.”
Honesty required here: we do not have a measured number for how large is large enough to move the rate. Measuring it means putting your own position in to find out, and the cost of that experiment is the result of the experiment. What can be said is the direction: it is real, and it gets monotonically worse as your share of notional rises. Anyone telling you this approach has unlimited capacity is telling you something useful about themselves.
The four walls in order
| Wall | When it arrives | What it limits | What can be done |
|---|---|---|---|
| Order book depth | Earliest | Speed of entry and exit | Slice and stagger; the entry window gets longer |
| Tiered margin | As single-symbol notional grows | Notional per unit of margin | Lower the multiple, or split across symbols |
| Symbol count | Further up | Total notional | No good answer; you absorb it |
| Pressing the rate yourself | Latest, and not reversible | The rate itself | Same |
The first two are engineering problems; effort mitigates them. The last two are market structure; effort does not. A strategy’s real capacity ceiling is set by the last two, not the first two.
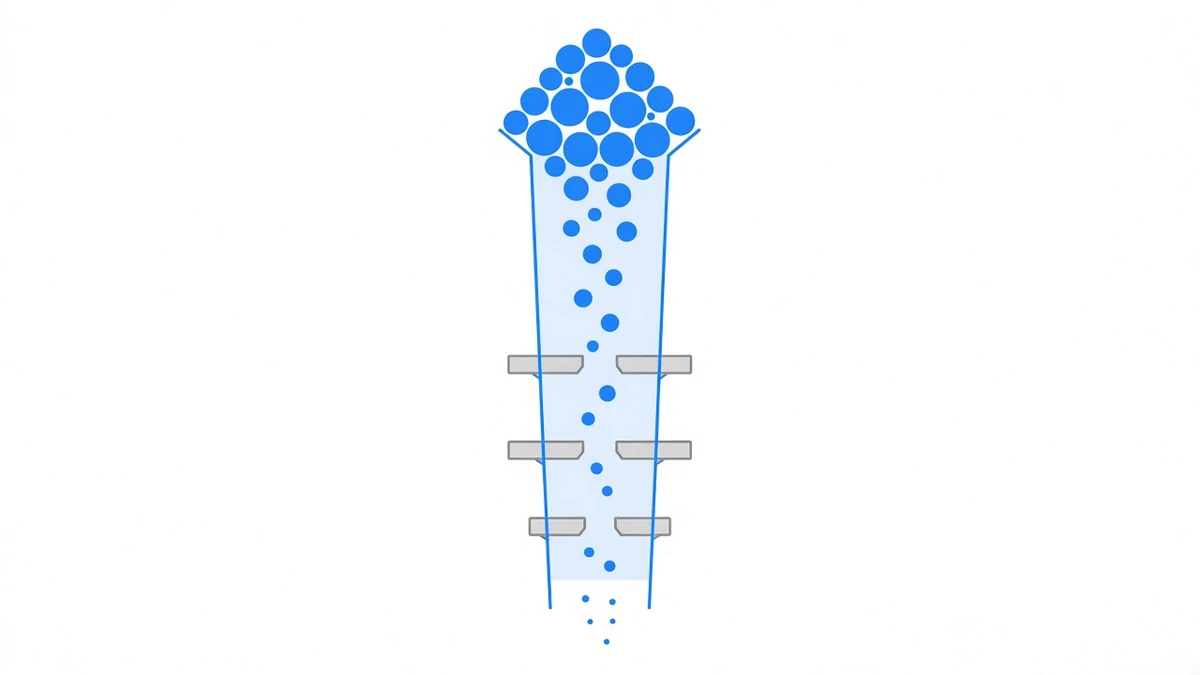
What a platform can do about it
A platform cannot make these walls disappear. It can do three things: push the first two further out (execution and slicing, spreading across accounts), get the selection right on the third, and write the fourth into the terms as a real constraint rather than pretending it is not there.
That is one reason the investment plans are tiered by amount: 5,000–20,000 USDT, 20,000–100,000 USDT and 100,000 USDT and above, with different terms attached (1 year, 3 years, 5 years). More money means the cost of entering and rebalancing needs a longer holding period to amortise — that is not sales segmentation, it is a direct consequence of wall one.
All three tiers carry the same 2% annual management fee, deducted from returns. Funds are held in the platform’s dedicated account; balance, individual transactions, positions, the return curve and withdrawal progress are visible on the investor side. Custody and performance rest with the platform, which means platform credit risk exists.
How to tell whether this applies to you
Three numbers you can work out yourself:
- What share of the top few book levels does one leg of your order take? Above roughly ten percent, start thinking about slicing.
- Which tier of the margin table does your single-symbol notional sit in? At the moment you cross, yield and safety margin change together.
- What share of that symbol’s total open interest is your total notional? That ratio is a rough thermometer for wall four.
If all three are small, capacity is not your problem — go read the six hidden costs instead.
To finish the sentence properly: balancing two legs removes directional price risk, not all risk. Funding goes to zero and turns negative — the 0.787256% ETHUSDT line for 2022 on the track record page is how that happened, and SOLUSDT is at −1.125987% year to date. Good numbers this year do not imply good numbers next year.
Sources: open interest from CoinGlass (2026-09-18, via ChainCatcher), used only as a scale reference; our own funding figures come from the backend period-by-period snapshot, as of 2026-08-25 13:42 UTC; plan terms are whatever the investment plans page says. Tiered margin thresholds vary by symbol and exchange and can be changed by the exchange at any time. Past performance does not indicate future results. This is not investment advice.