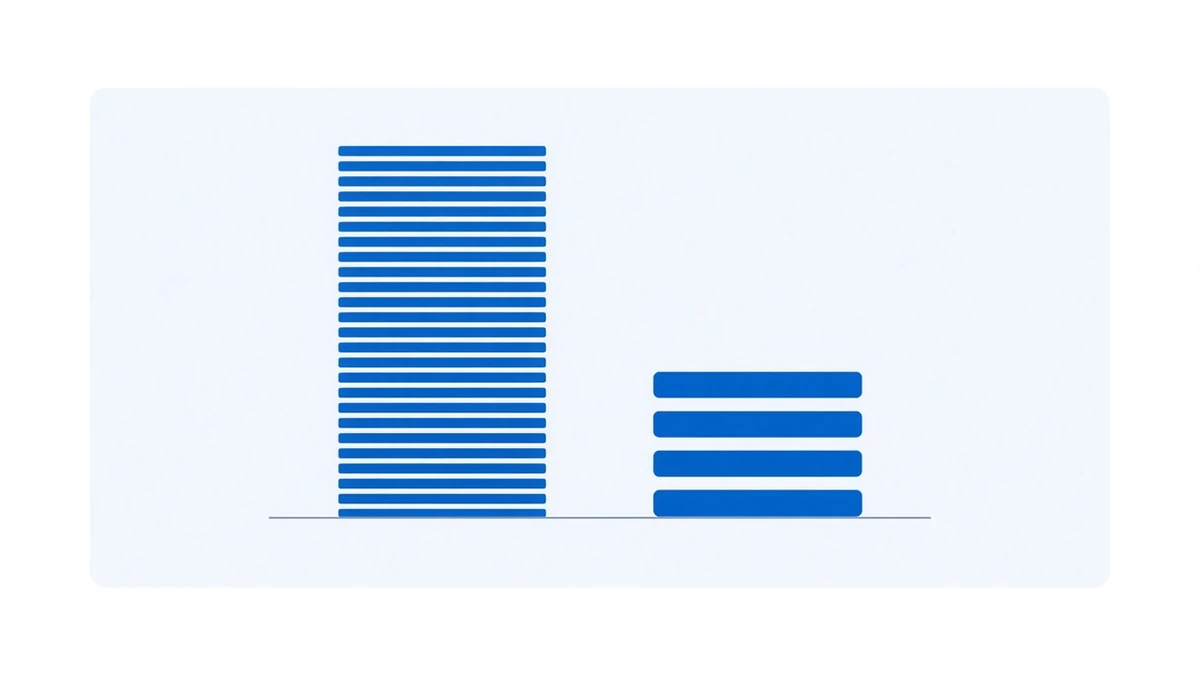
Open any funding rate leaderboard and the first impression is always the same: the top is full of coins you have never heard of, and BTC is a long way down.
Aggregating every settlement in our database between 1 January and 22 September 2026, 03:00 UTC by contract (keeping only those with 300+ periods in the window):
| Contract | Periods | Cumulative funding |
|---|---|---|
| 1000000BOBUSDT | 1,584 | 56.082% |
| ESPORTSUSDT | 1,965 | 38.013% |
| 龙虾USDT | 1,167 | 31.054% |
| PTBUSDT | 1,606 | 28.137% |
| SPORTFUNUSDT | 1,490 | 26.923% |
| … | ||
| BTCUSDT | 793 | 2.126% |
| BNBUSDT | 793 | 2.111% |
| ETHUSDT | 793 | 1.301% |
| SOLUSDT | 793 | −0.912% |
56.082% against 2.126%. Twenty-six times. The ranking is not wrong — every number there is real. The problem is that the cumulative column answers a different question from the one you are asking.
Cut one: the period counts differ
Look at that second column. Over the same 264 days BTC went through 793 settlements and 1000000BOB went through 1,584.
Because BTC settles every eight hours (three a day) and that one settles every four (six a day). Cumulative funding equals per-period funding times the number of periods, and one of those two factors is already off by a factor of two. 321 of the 450 USD-M contracts now run on a four-hour cadence — the breakdown is in Binance funding settlement times.
ESPORTSUSDT is more extreme still: 1,965 periods, which works out to 7.4 a day, because part of this year it was switched to hourly funding.
Divide the cumulative figure by the period count and the ranking moves:
| Contract | Mean per period | Rank shift |
|---|---|---|
| 1000000BOBUSDT | 0.03540% | 1 → 1 |
| 龙虾USDT | 0.02661% | 3 → 2 |
| ESPORTSUSDT | 0.01934% | 2 → 3 |
| SPORTFUNUSDT | 0.01807% | 5 → 4 |
| PTBUSDT | 0.01752% | 4 → 5 |
| BTCUSDT | 0.00268% | |
| BNBUSDT | 0.00266% | |
| ETHUSDT | 0.00164% |
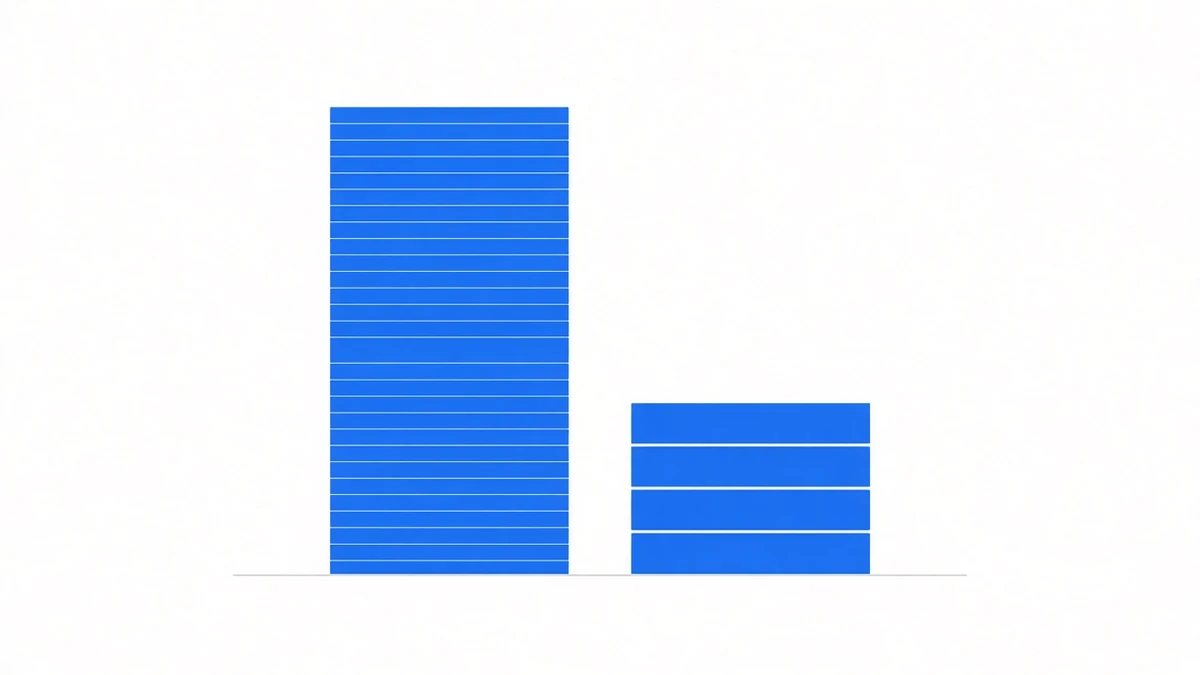
The gap between the top and BTC falls from 26x to 13x, and positions start swapping: ESPORTS drops from second to third, 龙虾 climbs from third to second. What separates them is not the market. It is how many times a day they charge.
Cut two: 13x is real, but the risk attached to it is one-sided
Thirteen times is still a lot. So why not go do it?
Start with a number that rarely appears on a leaderboard: Binance USD-M funding is hard-capped at ±2% per period. In 2026 so far, that line has been touched like this:
- −2% floor: hit 145 times, across 82 contracts
- +2% cap: 0 times
That asymmetry defines what the leaderboard is. On the upside you will never collect a period anywhere near 2%. On the downside it happened 145 times this year. The heaviest hitters were GUAUSDT (12), LYNUSDT (8) and LABUSDT (6).
Three contracts near the top of the leaderboard have taken that hit: the minimum single period for ESPORTSUSDT, PTBUSDT and BULLAUSDT is an exact −2.0000% — not a number the market produced, a number the floor truncated. One period at −2% takes ESPORTS 103 periods at its own average to earn back.
Cut three: the share of negative periods beats the cumulative column
Add “share of periods negative” and the leaderboard starts to look like something you could act on:
| Contract | Mean per period | Periods negative | Worst single period |
|---|---|---|---|
| FOLKSUSDT | 0.01643% | 0.00% | +0.0013% |
| HANAUSDT | 0.01635% | 0.37% | −0.1190% |
| 龙虾USDT | 0.02661% | 1.20% | −0.0167% |
| 1000000BOBUSDT | 0.03540% | 2.27% | −0.0482% |
| SPORTFUNUSDT | 0.01807% | 2.08% | −0.1574% |
| BULLAUSDT | 0.01517% | 4.99% | −2.0000% |
| ESPORTSUSDT | 0.01934% | 7.38% | −2.0000% |
| BTCUSDT | 0.00268% | 26.36% | −0.0152% |
| ETHUSDT | 0.00164% | 31.15% | −0.0365% |
| SOLUSDT | −0.00115% | 49.18% | −0.3028% |
Two things in that table are worth stopping on.
First, FOLKSUSDT has not had a single negative period in 1,612 settlements this year — its lowest is +0.0013%. Its mean per period is lower than ESPORTS. On the cumulative ranking it sits seventh and none of this is visible.
Second, SOL’s cumulative funding this year is negative: 49.18% of its 793 periods came in below zero, −0.912% for the year. A major is not automatically a safe one, a row we keep in which coins suit funding rate arbitrage rather than quietly dropping.
Cut four: only surviving contracts are on the board
This one is the hardest to spot yourself, because it does not appear as a number.
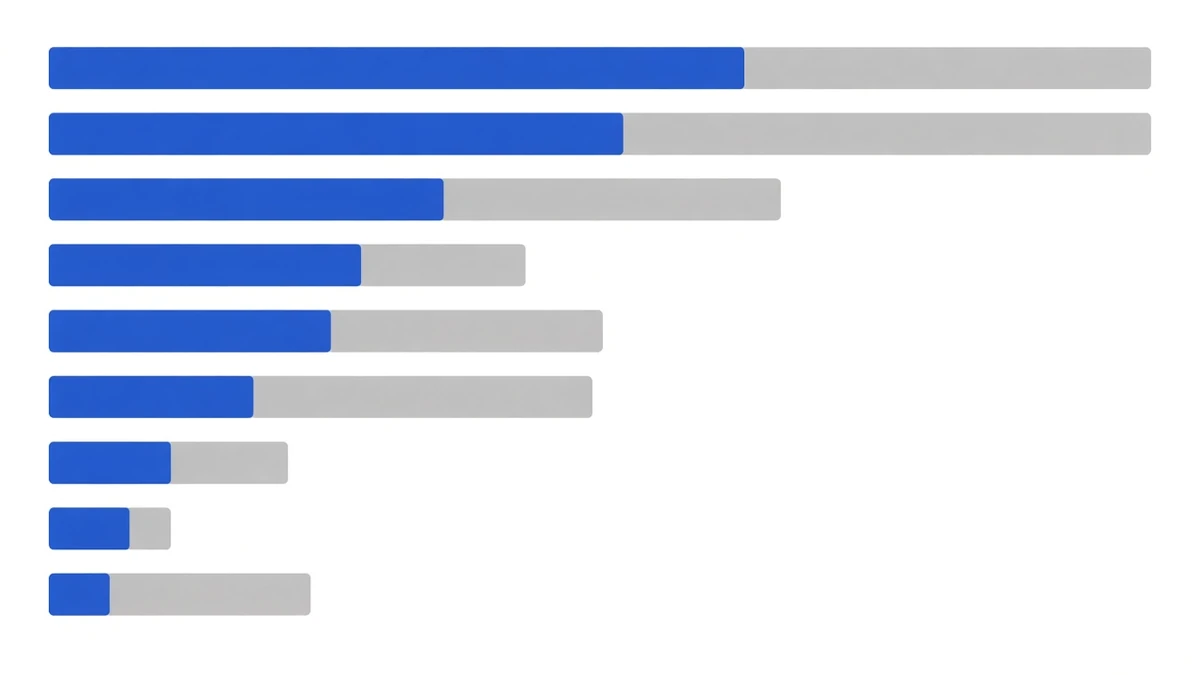
Our database holds 450 contracts and not one of them has gone quiet in the last 30 days. That sounds like good data hygiene. What it actually exposes is something else: the collection list follows the exchange’s current contract list, so the moment a contract is delisted it stops appearing in the list at all.
Which means every funding leaderboard — including ours — only counts the contracts that are still here today. The ones that topped the board earlier in the year and were later pulled do not drag down any average. A real case of one contract being delisted by four venues 23 days apart is in ICX perpetual delistings.
One related point: the earliest settlement for the contracts near the top of that board is August 2025 (龙虾USDT is later still, March 2026). BTCUSDT’s first period is 1 January 2020, 7,369 periods ago. Comparing the annualised figure of a contract that has lived seven months with one that has lived six and a half years is not comparing the same thing.
So how should you read a leaderboard
It is useful, but only as the first step of a filter. Add three columns, in order:
- Period count, or cadence. Without it the cumulative column is not comparable. Six-a-day and three-a-day side by side differ by a factor the market had nothing to do with.
- Share of periods negative. This directly determines how often you are paying out. FOLKS at 0.00% and SOL at 49.18% are two different businesses.
- Worst single period. A value of exactly −2.0000% should make you pause — it is truncated, meaning the real pressure was larger.
Then come the things a leaderboard never mentions: whether the spot leg can actually be filled, how wide the spread is, how many periods a round trip takes to repay. The six costs that never show up in a table are in six hidden costs; how much capital the strategy can absorb is in four ceilings.
As for what we run ourselves: the year-by-year record is in performance, worst years on the same table; how the two legs are run is in how it works.
Data: per-settlement funding rates from our own collection database (sourced from Binance’s public USD-M endpoints). Leaderboard window 2026-01-01 to 2026-09-22 03:00 UTC, 603,966 periods across 450 symbols, showing only contracts with 300+ periods in the window. Cumulative figures are sums of per-period rates, not compounded; mean per period is window cumulative divided by window period count. ±2% is the Binance USD-M per-period cap and floor; cap hits are counted as |rate| ≥ 2%. Cadence is determined from gaps between consecutive timestamps, not the interval field in the database. Yearly cumulative figures are in performance, site snapshot 2026-08-25 13:42 UTC. Contract tickers appear here as data, not as recommendations. Past performance does not indicate future results.