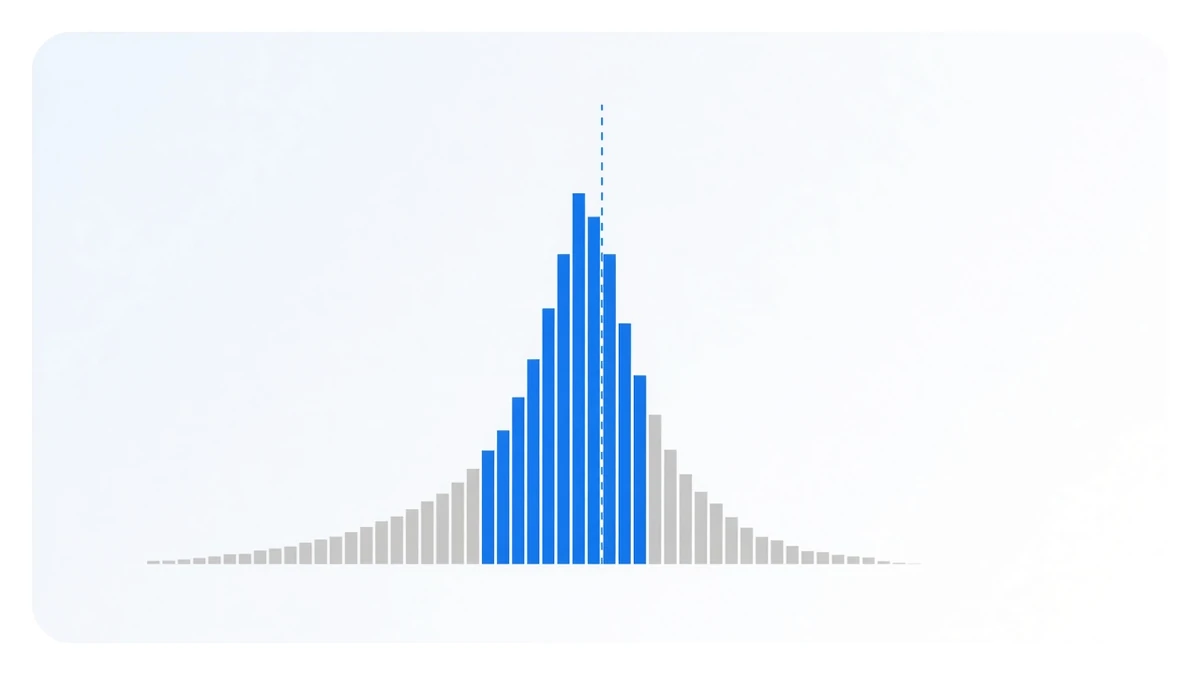
A funding leaderboard answers how good the best ones are. Far fewer people ask the other side of it: pick a contract at random, collect its funding for a year, and what is the expected outcome?
Summing every settlement between 1 January and 24 September 2026, 03:00 UTC for each of the 450 Binance USD-M contracts in our database gives one number per contract. Laid out, the 450 numbers look like this:
| Percentile | Cumulative funding, 2026 |
|---|---|
| Worst | −172.7302% |
| 10th | −33.7329% |
| 25th | −14.2579% |
| Median | −0.5646% |
| 75th | +3.5159% |
| 90th | +7.3650% |
| Best | +56.3574% |
| Arithmetic mean | −9.1568% |
206 came out positive; 244 came out negative. Which is to say: had you closed your eyes at the start of the year, drawn one of the 450, bought spot and shorted the perp to collect funding, there was a 54% chance of paying rather than being paid — before any fees.
The mean sits 8.6 points below the median, and the gap is all in the left tail
Median −0.5646%, mean −9.1568%. When a mean falls that far below its median there is only one explanation: a handful of contracts on the left lost enormously.
| Contracts | |
|---|---|
| Cumulative at −50% or worse | 29 |
| Cumulative within plus or minus 1% | 50 |
| Cumulative within plus or minus 5% | 203 |
| Cumulative at +10% or better | 32 |
| Cumulative at +20% or better | 16 |
The extremes are absurdly far apart: best is 1000000BOBUSDT at +56.3574%, worst is HOMEUSDT at −172.7302% — a spread of 229 percentage points. The bottom of the table is all three-digit negatives: LABUSDT −152.9124%, BARDUSDT −138.7060%, ONGUSDT −138.5642%, SENTUSDT −126.9724%.
A contract losing more than 1.7x notional in funding over a year sounds impossible, but these are just sums of periods: a little each settlement, two thousand-odd settlements a year, and that is the magnitude you get.
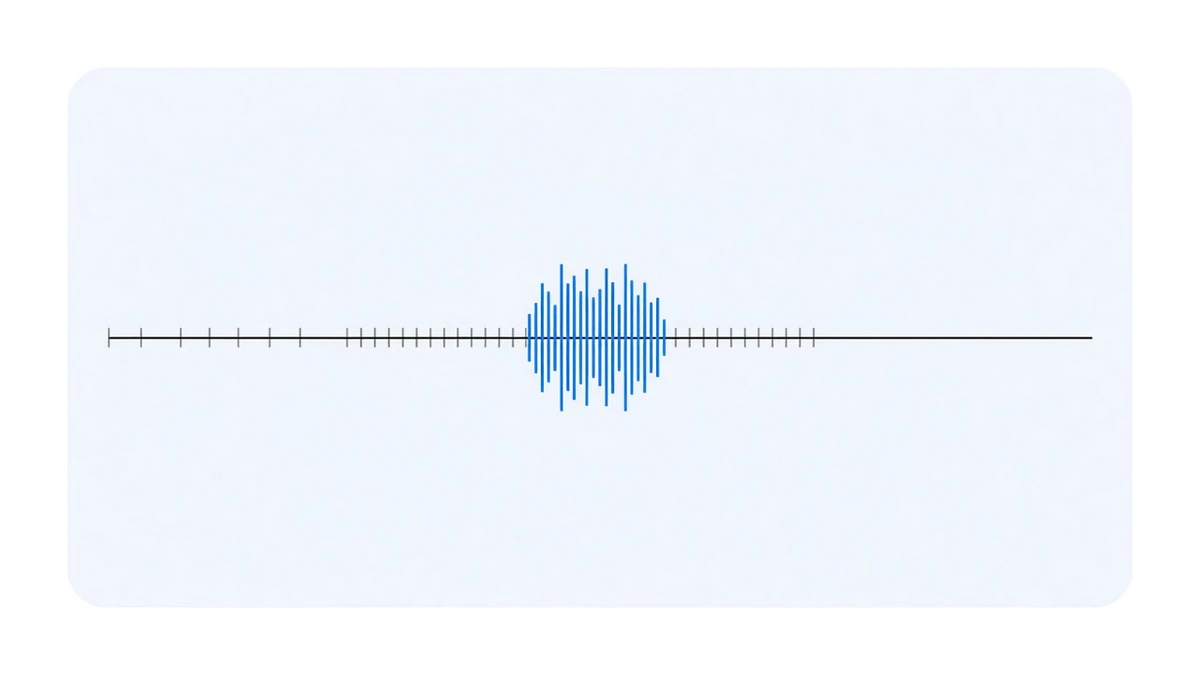
Cut out 95 contracts and the conclusion changes character
What makes this table useful is that the left tail is not scattered randomly across the 450. Group out the contracts that were switched to hourly settlement at any point this year:
| Group | Contracts | Mean | Median | Positive | Worst |
|---|---|---|---|---|---|
| Had hourly settlement in 2026 | 95 | −37.1627% | −27.1113% | 12 | −172.7302% |
| Everything else | 355 | −1.6623% | +0.8854% | 194 | −53.4166% |
One market, one cut, two worlds. Only 12 of those 95 are positive this year, with a median of −27%; the remaining 355 have a median back at +0.8854%.
Why does the line work so well? Because an exchange temporarily moving a contract to hourly funding is already managing a basis that has gone out of control — this is not a leading indicator, it is the symptom itself. That cohort ran 89.25% negative periods during the switched stretches, detailed in Binance funding settlement times.
Do not read it as an all-clear, though: of the remaining 355, 161 are still negative this year — 45.4% of them — with the worst at −53.4166%. The cut removes the ugliest tail, not the risk.
Where the majors sit in this distribution
| Contract | 2026 cumulative | Periods |
|---|---|---|
| BTCUSDT | +2.1419% | 799 |
| BNBUSDT | +2.1200% | 799 |
| ETHUSDT | +1.3396% | 799 |
| SOLUSDT | −0.8949% | 799 |
All four majors land between the median (−0.5646%) and the 75th percentile (+3.5159%). They are not at the top — nowhere near the 90th percentile — but they are also not in the tail, and the tail is where this table does its damage. SOL is negative this year, a line we keep in which coins suit funding rate arbitrage rather than quietly dropping.
Seen against the whole distribution, the real merit of the majors is not a high rate. It is low variance: they do not show up on the list of 29 contracts that lost more than 50%.
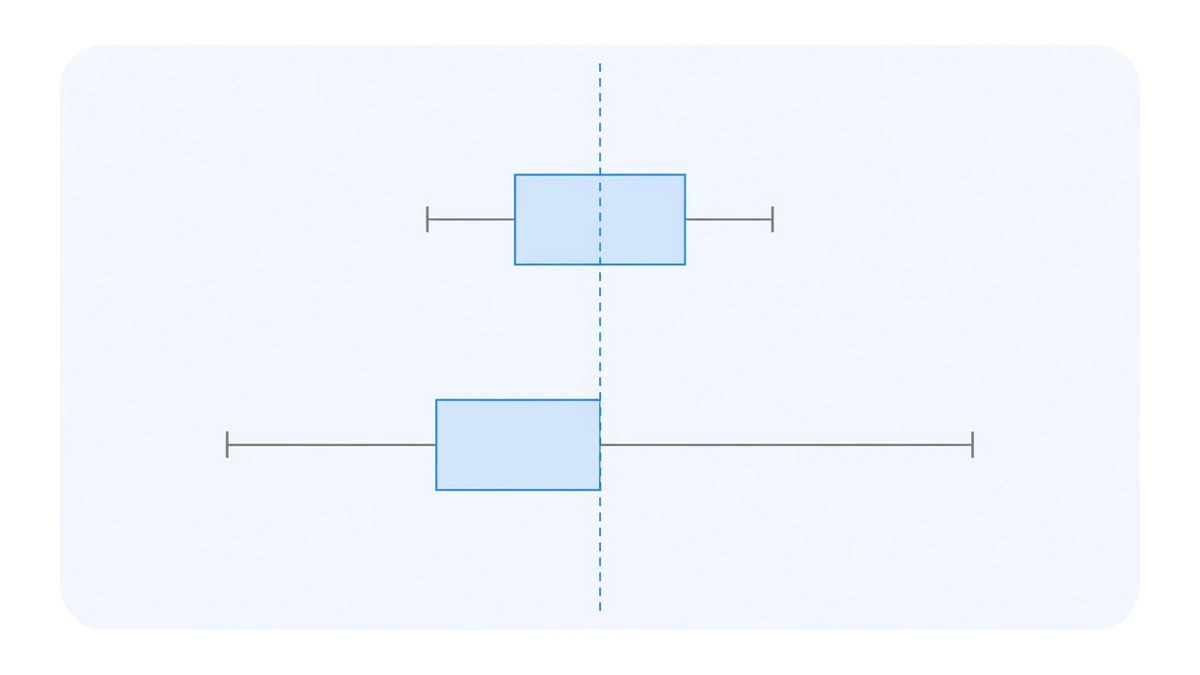
What the table is actually saying
It is not funding rate arbitrage does not make money. It is: the work in this business is exclusion, not selection.
Those sound similar and point in opposite directions. Selection means reaching for the 90th percentile column — and the delivery rate at the top of the board is only 44.7% (measured in the week after a funding scanner crowns a leader). Exclusion means removing the 29 on the left and their neighbours, and that pays far more reliably: avoiding the −172% contract is easier than catching the +56% one, and it matters more.
Three exclusion rules you can compute straight from per-settlement data, without looking at price at all:
- Did it run hourly settlement this year? The median drops from +0.8854% to −27.1113%. No other single condition separates as sharply.
- Share of negative periods. It determines how many periods you spend paying out, and it is far steadier than the cumulative figure.
- Does the minimum period read exactly −2.0000%? That is Binance’s hard floor; seeing it means the real pressure was truncated and the situation is worse than the books show.
This is why we file symbol selection under risk rather than return in the risks in funding rate arbitrage. 244 of 450 contracts are charging you this year, and that fact does not appear on anybody’s annualised-yield graphic.
What we run and how the two legs are placed is in how it works; the year-by-year record, worst year included, is on performance.
Data: per-settlement funding rates from our own collection database (sourced from Binance’s public USD-M endpoints), window 2026-01-01 00:00 UTC to 2026-09-24 03:00 UTC, 608,656 periods across 450 symbols. Each contract’s 2026 cumulative is the sum of its periods in the window (not compounded), with no adjustment for how long the contract existed or how often it settles; percentiles are the empirical distribution of the 450 contract values. Grouping rule: any contract with at least one period whose settlement-interval field reads one hour is counted in the hourly group. Fees, spread and slippage are excluded, so realised outcomes are lower. The collection list follows the exchange’s current contract list, so delisted contracts are not included. Contract tickers are shown to document the data, not as recommendations. Past data does not indicate future returns.