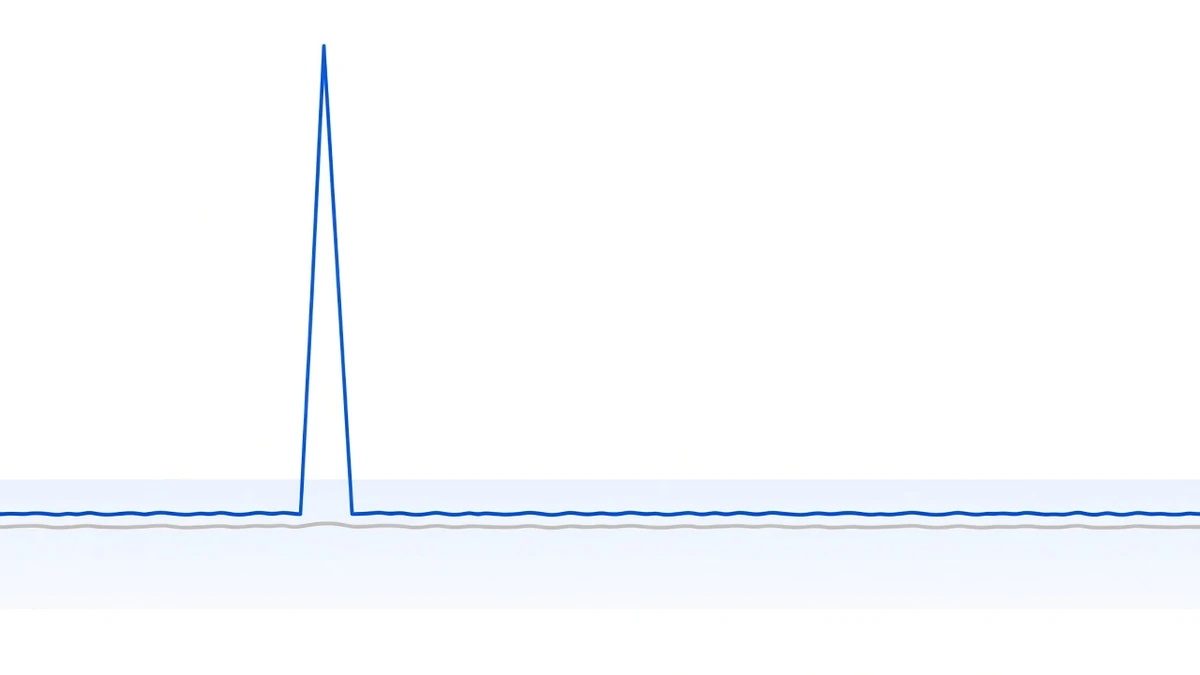
Ask the question precisely. For a position with both legs balanced, the threat in “a stablecoin depegs” is not the layer where a coin’s price falls — it is whether your three units of account are the same thing.
In a standard position, stablecoins appear in three places at once:
| Position | What it does there | Typical value |
|---|---|---|
| Quote currency of the spot leg | You bought BTC with it | USDT or USDC |
| Margin of the perp leg | The liquidation price is computed in it | USDT (USD-M) |
| Settlement currency of funding | It is what arrives each period | USDT |
When all three are the same coin, a depeg does nothing to neutrality itself. Your whole ledger is denominated in it: USDT drops to 0.95 dollars and your margin, your cost basis and the funding you collect all drop together, leaving the hedge untouched. What you lost is purchasing power — a real loss, but unrelated to the strategy. Money sitting idle in a wallet loses exactly the same.
The case that actually bites is when the three disagree. Buy the spot leg on a USDC pair while margining in USDT, and the relative drift between USDC and USDT becomes real P&L that has nothing to do with your delta. You believed you had one exposure; you actually acquired a second, unhedged currency exposure.
How far they actually moved this year
Fear is easy to write; numbers are harder to invent. We pulled the full daily history for the USDCUSDT and FDUSDUSDT pairs on Binance spot (1 January to 21 September 2026, 264 candles each):
| Pair | Days closing >0.1% off | Days closing >0.5% off | Highest close | Lowest close |
|---|---|---|---|---|
| USDCUSDT | 25 / 264 | 0 | 1.0019 (02-04) | 0.9994 (04-14) |
| FDUSDUSDT | 146 / 264 | 0 | 1.0037 (01-14) | 0.9975 (06-05) |
Honestly: sustained depeg did not happen this year. Across 528 combined trading days of closing prices, not one closed more than half a percent away. FDUSD spent 146 days more than 0.1% off, which sounds like a lot, but 0.1% is smaller than many people’s resting spread.
Saying so plainly matters. Frightening readers with a risk that did not materialise this year is exactly as dishonest as hiding it.
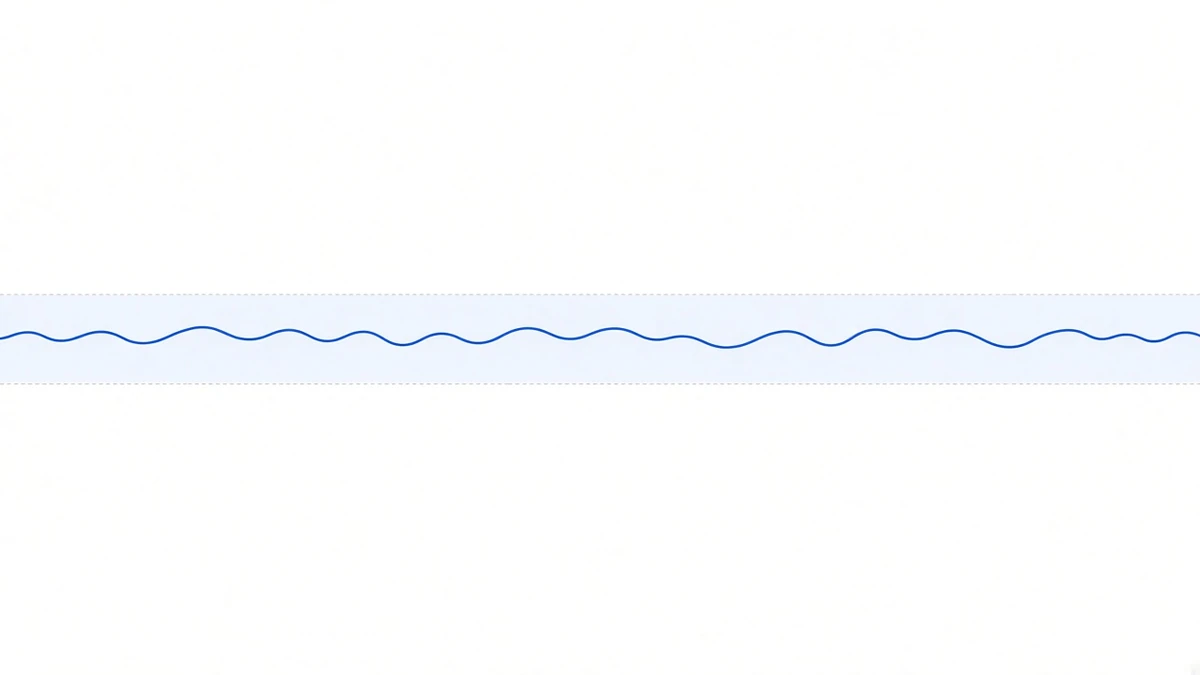
But the hourly candles show wicks, and wicks are the kind that bite
Drop from daily to hourly granularity and the picture changes completely:
| Pair | Intraday high | Date | Hours above 1.005 that day |
|---|---|---|---|
| FDUSDUSDT | 1.1932 | 02-24 | 1 / 25 |
| USDCUSDT | 1.0219 | 05-28 | 1 / 25 |
FDUSD’s print was +19.32%, on a day that closed around 1.0007. Out of twenty-four hours, exactly one had a high above 1.005; the rest sat on the peg.
That is what makes it hard to handle: a wick does not need to persist, it only needs to appear once at your thinnest moment. Liquidation engines, stop orders and collateral valuations all price off the tick as it happens; none of them wait for you to read the close. A single one-hour shadow barely registers in the average, and is the entire story for a position sitting right on the line.
Worth saying: those two wicks were almost certainly thin-liquidity fills rather than the market genuinely valuing FDUSD at 1.19 dollars. To a mechanism that triggers on traded price, that distinction does not exist.
Down is not the only direction
Nearly every article about depegging talks about falling to 0.95. Both numbers above went up.
For a two-legged position, upward drift bites too, and differently:
- With a USDC spot leg and USDT margin, USDC strengthening flatters the spot side’s book value, while the transfer you need in order to top up margin has to be converted into USDT first — at that moment’s price, spread included.
- In reverse, buying collateral right as an upward wick prints simply raises your cost basis.
This is why quoting a stablecoin pair as “1:1 cash” eventually causes trouble: it is right 99.9% of the time, and the remaining 0.1% is precisely when you needed it to be right.
So what do you actually do
Nobody can forecast a depeg, so all three of these are structural rather than timing measures.
- Keep the three units of account identical where you can. USDT pair for the spot leg, USDT margin, USDT settlement. Every additional coin adds an unhedged exposure, and the new one will not show up on any report that says “sensitivity: zero.”
- When you must mix, treat it as a trading pair, not a constant. Any path that requires a USDC ↔ USDT hop has to carry that spread into all-in cost — it belongs to the family of things in the six hidden costs that the interface never shows you.
- Size the liquidation buffer for the wick, not the average. This is the same point as the two trigger lines in rebalancing is not about delta: the room you leave is for the worst single candle, not for typical conditions.
One more layer: issuer risk is not in the price
Every number above measures secondary-market price. What it cannot measure is the other thing: whether the issuer can redeem at 1:1, what the reserves actually hold, how broad the freeze authority is. Price will not tell you any of that before a depeg; it only prints the result afterwards.
So that layer is not a measurable risk. It belongs with the counterparty risk in both legs live inside an exchange: it cannot be hedged, only capped. Putting it on the risk list rather than into the model is the honest treatment.
Conclusion
Two sentences:
First, if your three units of account are the same coin, a depeg does not break your hedge. It costs purchasing power, and that is the risk of holding a stablecoin at all, not the risk of the arbitrage.
Second, if they are not the same, you are carrying an exposure nobody told you about. On closing prices it stayed quiet all year — 528 trading days, zero above 0.5% — while the hourly candles printed 1.1932. Quiet is the norm; the wick is the price.
This is why who carries which risk sorts risks by whether they can be hedged rather than by how likely they are: a low-probability risk that settles in a single stroke cannot be argued away with a historical average. The platform-level risks that genuinely exist are listed under security and risk.
Sources: daily and hourly candles for USDCUSDT and FDUSDUSDT from Binance’s public spot endpoint api/v3/klines, range 2026-01-01 to 2026-09-21, 264 daily candles each, read at 2026-09-21 07:36 UTC; “deviation” always means deviation from 1.0000, measured on the daily close for the closing view and on that day’s hourly high for the intraday view; these are traded prices on a single venue and do not represent a market-wide mid. Past performance does not indicate future results.