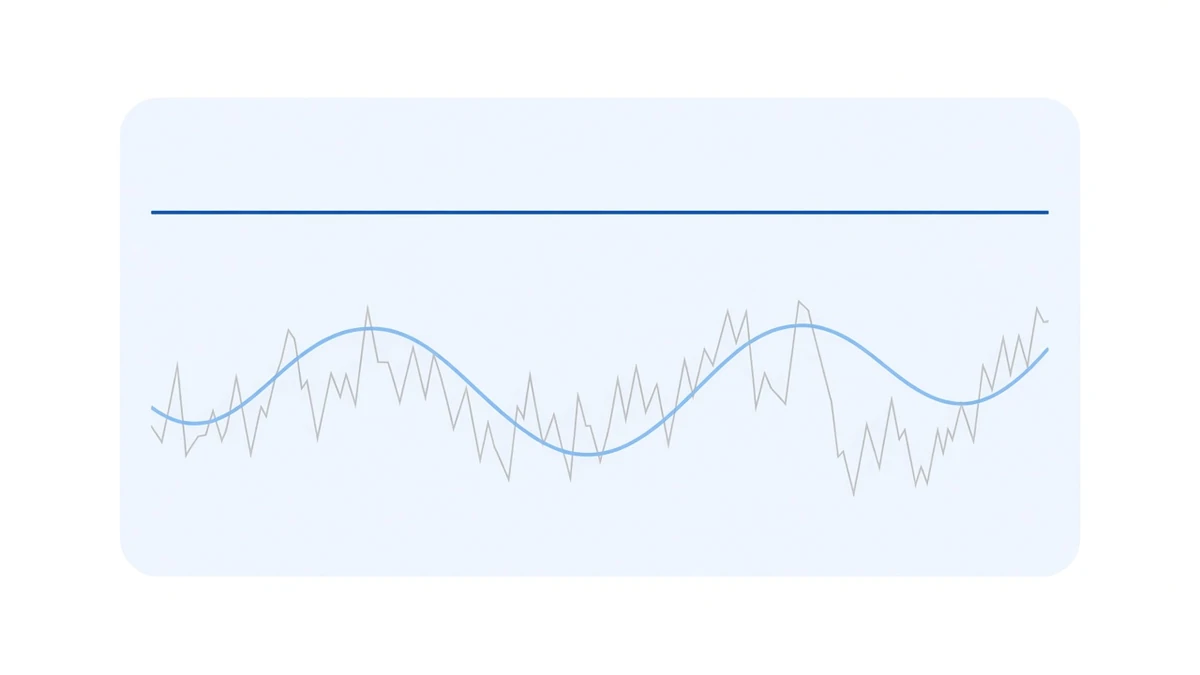
The word neutral gets used very loosely in crypto. It refers to at least three different things, and they protect different parts of your book.
| Name | What it claims is zero |
|---|---|
| Delta neutral | the portfolio’s first-order sensitivity to the price of the underlying |
| Beta neutral | the regression slope of portfolio returns against a benchmark such as BTC |
| Market neutral | the strategy’s returns are unrelated to whether the market rises or falls |
Funding rate arbitrage is the first. It is not the third. That distinction is not academic — it decides what you should expect from the strategy.
First, what delta neutral genuinely delivers
The two legs are matched in coin terms: hold 1 BTC spot, short 1 BTC of the perpetual. Price runs from 80k to 120k and the spot leg gains exactly what the perp leg loses. This is structural, not predictive — no forecast required, no constant adjustment.
This year has a clean example: in June 2026 BTC fell 20.43%, and BTCUSDT funding for that month summed to +0.2031%. A fifth of the price gone; the income from the position unchanged, and still positive.
That is delta neutrality doing its job, and it does it well. The single thing to watch is that the test for matched legs is equal delta, not equal notional in account terms. Splitting 10,000 USDT into 5,000 and 5,000 is not neutral; the arithmetic is in sizing a delta-neutral position.
But the income has a direction: 0.3658 across 38 months
A position with no price exposure does not imply income with no market exposure. Put BTC’s monthly return next to the same month’s summed BTCUSDT funding, for the 38 months from August 2023 to September 2026:
| Value | |
|---|---|
| Pearson correlation | 0.3658 |
| Mean monthly funding, up months (23) | 0.7042% |
| Mean monthly funding, down months (15) | 0.4493% |
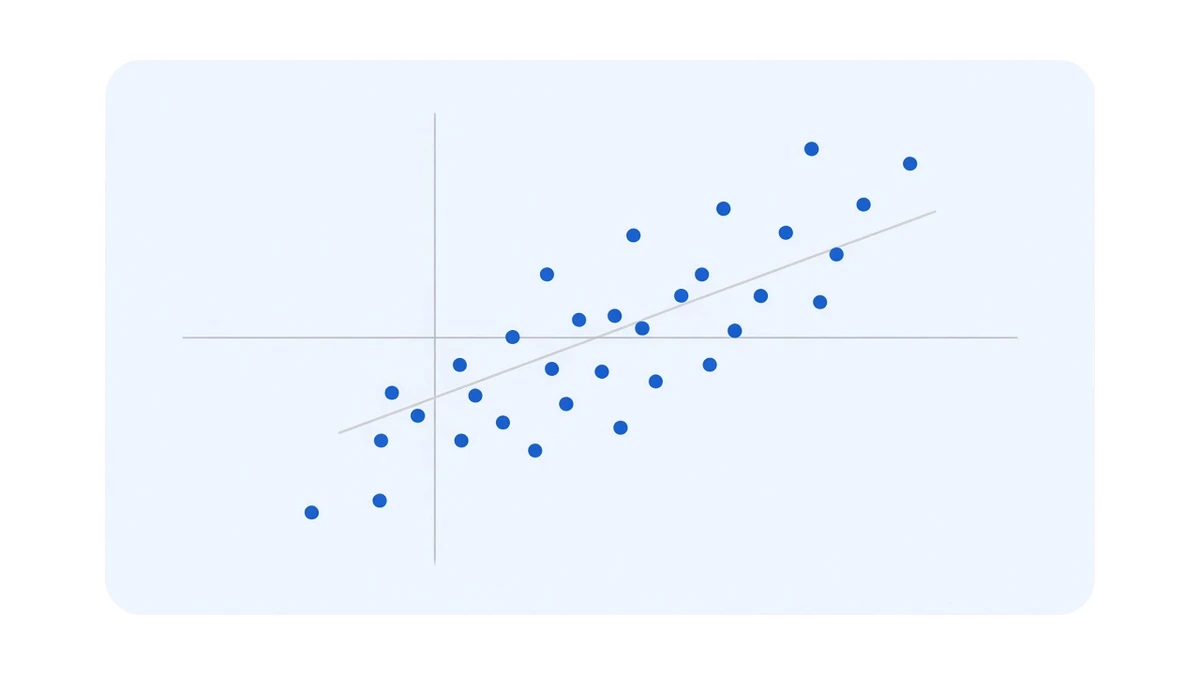
0.3658 is not a strong correlation, but it is clearly not zero. Funding in up months averages 1.57x what it averages in down months.
The mechanism is plain: funding is rent paid by leveraged longs, and more people want to pay that rent when the market is going well. Your position does not bet on direction. Your tenants do.
Two counterexamples, which is why it is only 0.3658
If the correlation were 0.9 this would be a long position wearing a neutral costume. It is 0.3658 because the two decouple often:
| Month | BTC return | Funding that month |
|---|---|---|
| 2026-04 | +11.82% | −0.1772% |
| 2026-06 | −20.43% | +0.2031% |
| 2024-03 | +16.60% | +3.1402% |
| 2025-02 | −17.66% | +0.3879% |
April 2026 rose 11.82% with negative funding; June fell 20.43% with positive funding. The two can point opposite ways because funding tracks the basis, not the direction. Whether funding disappears when the price collapses is its own piece: when the price crashes, does funding disappear with it.
So the accurate description is: on a monthly scale it does not follow the market; on an annual scale it follows the cycle.
The annual scale is where it matters
Lay out cumulative BTCUSDT funding year by year and the cycle is far clearer than any monthly correlation:
| Year | BTCUSDT cumulative funding |
|---|---|
| 2021 | 30.635167% |
| 2024 | 11.980480% |
| 2023 | 7.842115% |
| 2025 | 5.132678% |
| 2022 | 4.164925% |
| 2026 (to the 25 Aug snapshot) | 1.589788% |
2021 and 2026 are 19x apart. Same delta-neutral structure, same symbol, same exchange. All that changed is how many people were willing to pay rent.
That is what not market neutral really means: you will not lose principal because the price fell, but you will sit through a bear market attached to a very thin yield. The risk turns from losing money into earning very little — an enormous improvement, and not the same thing. The full year-by-year path, worst year included, is in six years of funding and on performance.

Beta neutral: the third name, most often mistaken for the first two
Beta neutral means regressing your return series on a benchmark and getting a slope of zero. The difference from delta neutral is this: delta is computed, beta is fitted.
A beta fitted on historical data stops working when the market’s structure changes; a hedge of one coin long spot against one coin short perp does not, because it depends on no estimate at all. Treating beta neutrality as delta neutrality is one of the three classic errors listed in the sizing piece.
As for delta neutrality in options, that is a different animal again: it has to be maintained by continuous re-hedging, and what it earns is volatility. The comparison is in delta neutral explained.
How to use the three words
Next time a product describes itself as a neutral strategy, ask three questions:
- Which variable is claimed to be zero? Price sensitivity, benchmark regression slope, or the relationship between returns and the market. They are not the same.
- Is it structural or estimated? The first only breaks through an operational failure; the second breaks when the market changes.
- What does the yield become in a bear market? This question is fair to put to any flavour of neutrality, and the answer should not be it does not change.
Our own answer to the third is the year table above: 30.6% in 2021, 1.59% in 2026 to the snapshot date. Both numbers on the same page, with no picking of the good year. How the two legs are actually placed is in how it works; who carries which risk is in the risks in funding rate arbitrage.
Data: funding rates and candles from our own collection database (sourced from Binance’s public endpoints). Correlation window August 2023 to September 2026, 38 months; monthly return = open of the month’s first 4-hour candle to the close of its last, monthly funding = the sum of that month’s BTCUSDT periods (not compounded). The start month is limited by the candle history; the final month (2026-09) has only 70 periods and is an incomplete month, but is still included in the correlation sample. Yearly cumulative figures come from the on-site snapshot taken 2026-08-25 13:42 UTC; the 2026 row is an unfinished year (711 periods) and is not averaged with complete years. 0.3658 is a Pearson correlation; correlation is not causation and carries no predictive power. Past data does not indicate future returns.