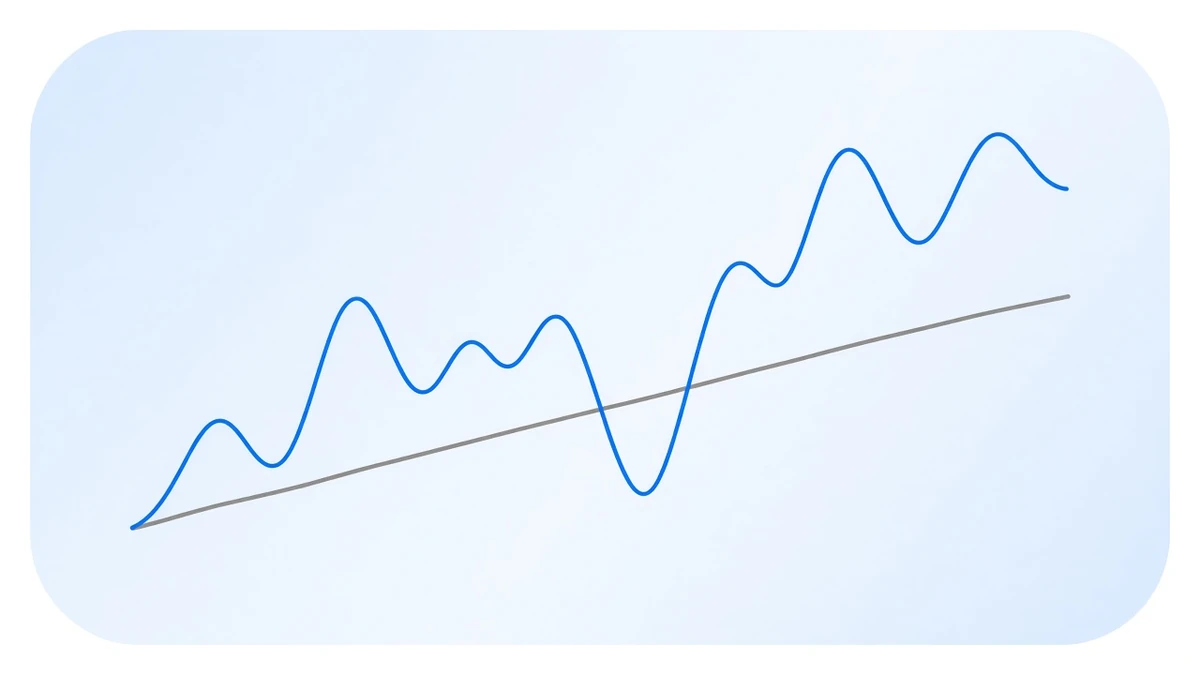
Over three years and two months BTC went from $30,459 to $79,912, a gain of 162.36%. Across the same window, Binance BTCUSDT funding rates summed period by period to 23.1963%.
On those two numbers alone, holding wins by more than seven to one. Add a third number and the comparison turns into something else: in that same window BTC’s maximum drawdown was 53.77%, while the deepest setback in the cumulative funding curve was 0.4125 percentage points.
Not 41 points. 0.41.
Where the three numbers come from
The window runs 1 July 2023 to 6 September 2026, 3.18 years. It was not cherry-picked. It is the complete overlap in our database between hourly prices and per-settlement funding.
Funding itself goes back to January 2020, but the mark price recorded at each settlement only started landing in the database in August 2025. Anything earlier has to come from the candles in the same database, and those begin in July 2023. Both sides have to exist, so the window is what it is. Worth saying up front, because the choice of window alone can decide the conclusion — start in 2020 and the holding return moves into a different order of magnitude.
- Price: 27,931 hourly BTCUSDT candles, first and last closes 30,459.10 → 79,912.10
- Funding: 3,492 settlements, 14.69% of them negative
- Convention: funding is summed period by period, not compounded
Summing and compounding are not the same thing. Positions here are opened by hand and the system never reinvests collected funding automatically, so performance is always reported as a straight sum; the compounded figure exists only as a reference. A separate piece covers why.
By quarter, the pattern is clearer than the total
| Quarter | Price | Change | Funding |
|---|---|---|---|
| 2023 Q3 | 30,459 → 26,951 | −11.52% | +1.1991% |
| 2023 Q4 | 26,977 → 42,314 | +56.85% | +3.0759% |
| 2024 Q1 | 42,504 → 71,363 | +67.90% | +5.5674% |
| 2024 Q2 | 71,234 → 62,766 | −11.89% | +2.3288% |
| 2024 Q3 | 62,925 → 63,309 | +0.61% | +0.8724% |
| 2024 Q4 | 63,513 → 93,549 | +47.29% | +3.1884% |
| 2025 Q1 | 94,364 → 82,518 | −12.55% | +1.2938% |
| 2025 Q2 | 82,598 → 107,087 | +29.65% | +0.8837% |
| 2025 Q3 | 107,328 → 113,989 | +6.21% | +1.7703% |
| 2025 Q4 | 114,181 → 87,608 | −23.27% | +1.1786% |
| 2026 Q1 | 87,773 → 68,242 | −22.25% | +0.3017% |
| 2026 Q2 | 68,288 → 58,605 | −14.18% | +0.2572% |
| 2026 Q3* | 58,549 → 79,912 | +36.49% | +1.2791% |
* Q3 only runs to 6 September, 204 settlements, so it is not a full quarter.
Six of the thirteen quarters were down for price, and 2026 Q1 and Q2 fell 22.25% and 14.18% back to back. The funding column is positive in all thirteen.
Do not read “all positive” as “all the same size”, though. The two thinnest quarters are exactly the two where price fell hardest: 2026 Q1 paid 0.3017% and Q2 paid 0.2572% — together less than a tenth of what 2024 Q1 paid on its own.
Funding does not flip negative because price falls, but it does get thin. Those two things get run together constantly. In a falling market it is the second one that actually happens.
The drawdown column
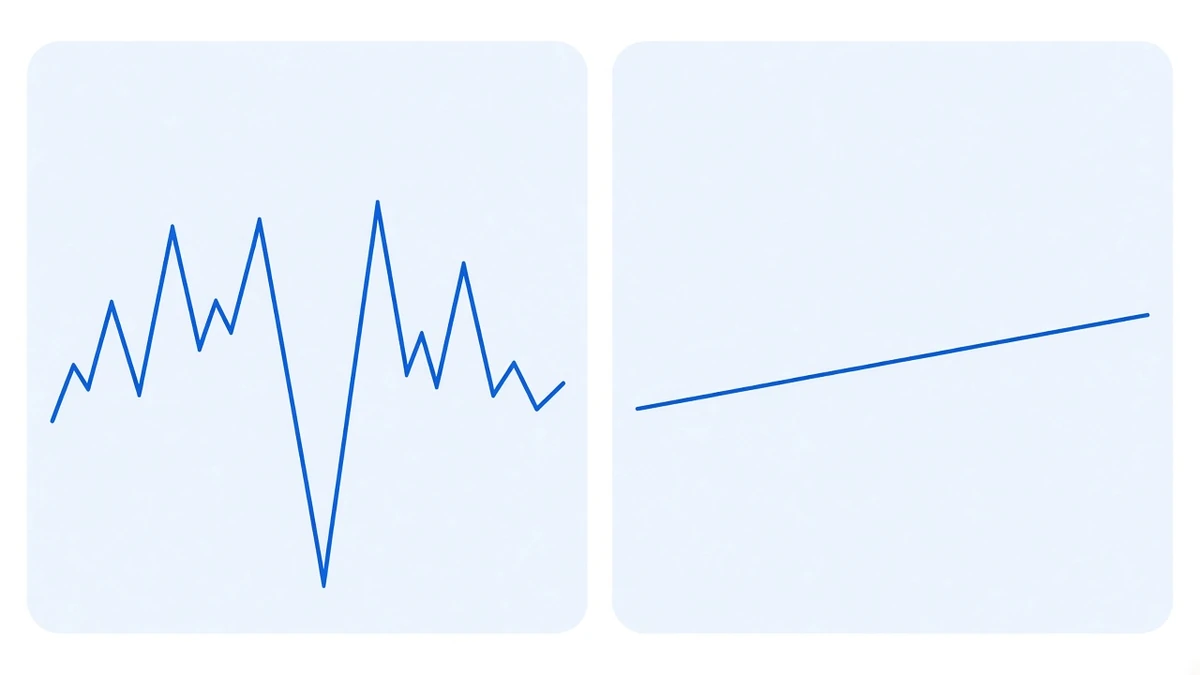
The worst stretch on the price line: from $125,986 down to $58,248, −53.77%, trough on 25 June 2026. Seven months in between, with more than half the position value gone on paper.
The worst stretch on the cumulative funding line: −0.4125 percentage points, trough on 9 May 2026. It is that small because a single funding period is small to begin with — the median BTC settlement is 0.009131% — so even a run of negative periods struggles to dig much of a hole.
The two curves are different shapes. One is a mountain range, the other a ramp. Annualised they work out at 35.38% (price, compounded) and 7.28% (funding, summed and divided by years), but once drawdown is in the frame those two numbers are not in the same comparison at all.
That 23.1963% is not a net return
To be blunt about it: the column above is the funding rate on one leg of BTCUSDT, not the net return of a strategy.
Actually running it means paying fees on both the spot and the perpetual side, moving capital between them, wearing slippage on entry and exit, and absorbing losses on every rebalance. The piece on hidden costs itemises them and there is no point repeating it here. On top of that, 513 of those 3,492 settlements were negative — in a negative period, a balanced two-leg book is the side that pays.
One more caveat: this window contained no extreme, prolonged negative-funding episode. History has produced them; the longest was eight days in March 2020. “Thirteen positive quarters” is a fact about these three years, not a rule.
So which one should you look at
Putting these two side by side is slightly unfair to both. They answer different questions.
Holding is a bet on price. The 162% assumes you did not sell during that −53.77% stretch, and what an account feels like through two consecutive down quarters in the first half of 2026 is something only the people who lived through it know.
A balanced two-leg book is a bet on something else: the directional exposure of the spot long and the perpetual short cancel out, and what remains is the funding cash flow. Its ceiling is obviously far lower, and thin years like 2026 make that obvious — the year-by-year table shows 2022 at 4.16%, the worst of the six, and we have not hidden it.
So the question is not “which is better”, it is “what are you paying for the return”. Holding pays in drawdown. Collecting funding pays in ceiling.
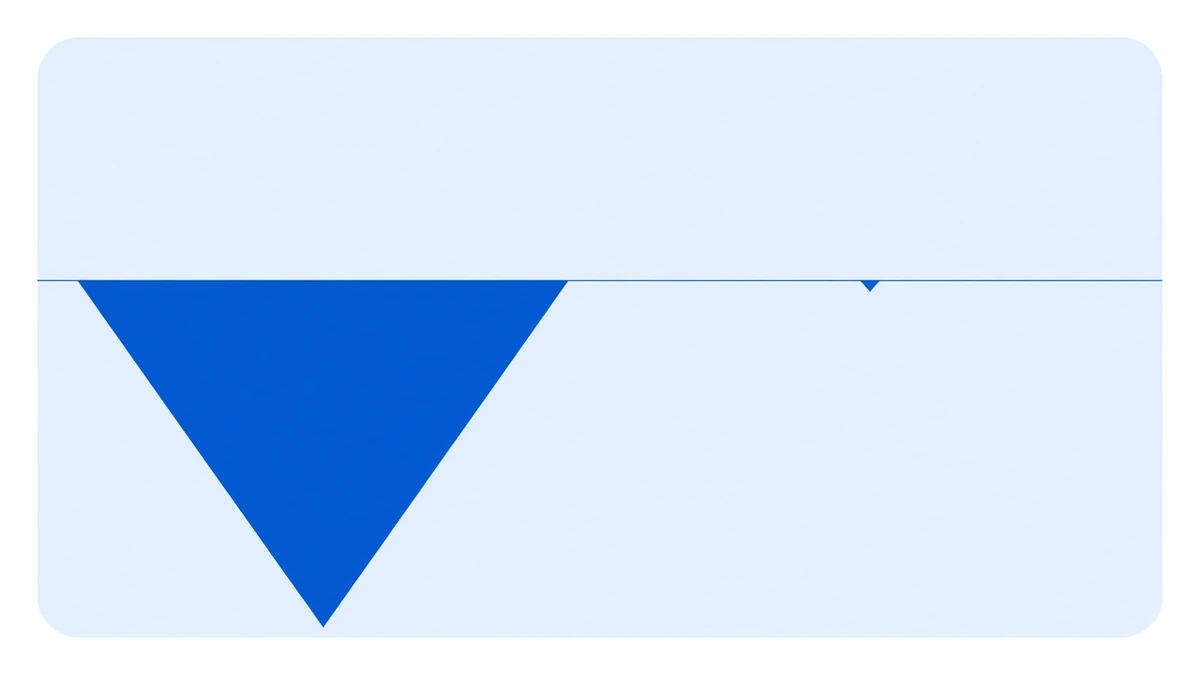
There is a practical test. Convert that −53.77% into your own capital, look at the number, and ask whether you would have slept through those seven months. If yes, take the first. If not, do not.
Data and as-of
Prices come from the Klines table in our own database, BTCUSDT hourly candles; funding comes from the per-settlement records in FundingRateTicks. Window 2023-07-01 to 2026-09-06 (UTC). The full funding series goes back to 2020-01-01 and covers 7,372 settlements. Year-by-year performance is whatever /performance/ says.
Every number here is a historical reading. Performance over a past window implies nothing about any future one.