On 25 September US spot Solana ETFs took in about $86.67 million net (SoSoValue figures), the category’s best day since launching in October 2025; the previous record was about $33.5 million. Bitwise’s BSOL alone took $55.73 million and Grayscale’s GSOL $18.47 million. As of the 26th, spot Solana ETFs held about $1.964 billion in net assets, with $1.605 billion in cumulative net inflows.
What did funding on Binance’s SOLUSDT perpetual do that week? Not what the ETF headlines would suggest.
ETFs: $188 million for the week, almost half of it on Friday
According to daily figures compiled by BigGo Finance, spot Solana ETFs took in $188.1 million over 21 to 25 September: $26 million on Monday, $28.9 million on Tuesday, $13.7 million on Wednesday, $32.8 million on Thursday and $86.7 million on Friday. Another tally (Crypto Briefing, as relayed by CoinNess) puts Friday at $80 million to $87 million and the week at about $181 million. The two broadly agree but are not identical.
The perpetual: 393 of 808 settlements negative this year
| Contract | Settlements in 2026 | Negative | Cumulative funding |
|---|---|---|---|
| BTCUSDT | 808 | 211 | +2.16% |
| ETHUSDT | 808 | 247 | +1.39% |
| BNBUSDT | 808 | 7 | +2.14% |
| SOLUSDT | 808 | 393 | −0.86% |
Of the four majors, SOL is the only one with a negative total for the year: a SOL perpetual short has been paying so far in 2026. Only 109 of its 808 settlements reached the 0.01% baseline. BNB’s seven negative periods look few only because 430 of its settlements were exactly zero; contracts with a zero interest rate spend much of their time at zero.
By month, SOL’s negatives cluster in the first half:
| Month (UTC) | Funding | Negative settlements |
|---|---|---|
| Jan | +0.18% | 31 / 93 |
| Feb | −1.03% | 70 / 84 |
| Mar | −0.50% | 62 / 93 |
| Apr | −0.01% | 48 / 90 |
| May | +0.05% | 38 / 93 |
| Jun | −0.38% | 64 / 90 |
| Jul | +0.19% | 28 / 93 |
| Aug | +0.39% | 27 / 93 |
| Sep (to the 27th) | +0.25% | 25 / 79 |
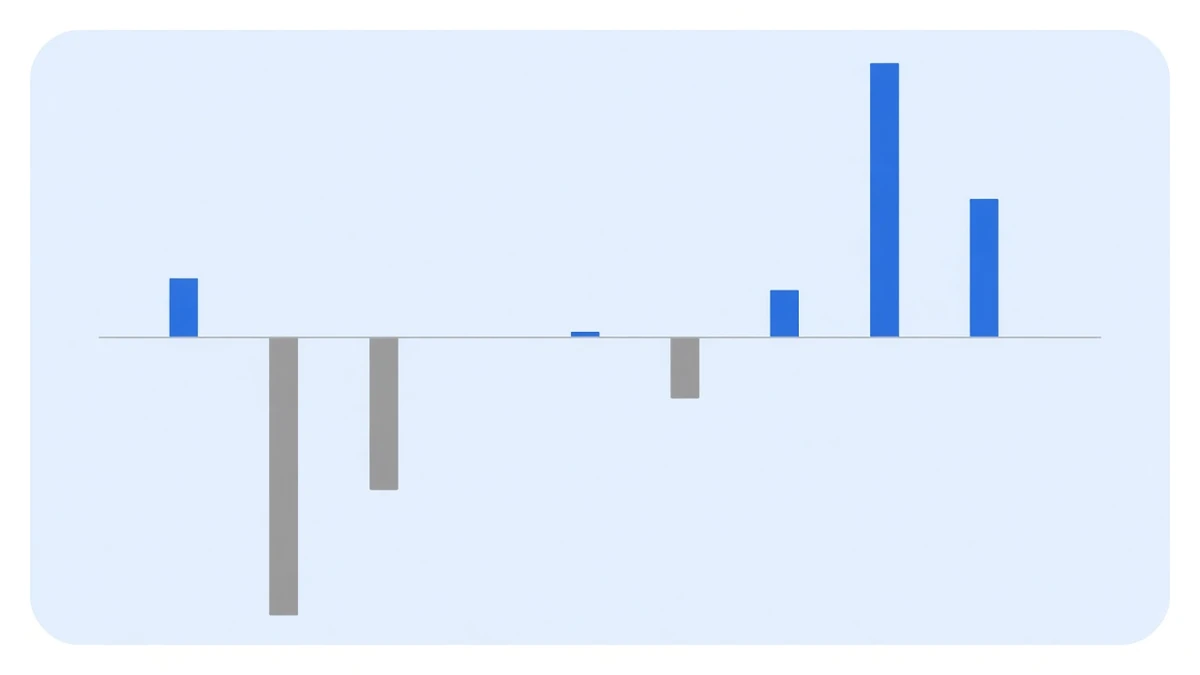
The first half summed to −1.70%; July to date is +0.83%. Three positive months in a row have not yet made up the first half.
What the perpetual settled around the record day
| Settlement (UTC) | Rate | Mark price |
|---|---|---|
| 09-24 16:00 | +0.004849% | 116.26 |
| 09-25 00:00 | −0.004015% | 116.99 |
| 09-25 08:00 | +0.010000% | 116.33 |
| 09-25 16:00 | +0.010000% | 120.07 |
| 09-26 00:00 | +0.003121% | 122.10 |
| 09-26 08:00 | −0.004180% | 120.69 |
| 09-26 16:00 | +0.007311% | 121.85 |
| 09-27 00:00 | +0.001484% | 121.35 |
The 08:00 and 16:00 settlements on the 25th both landed on the 0.01% baseline as the mark price climbed from around 116 to above 120, but the next day brought another negative period. For the full week (00:00 UTC on 21 September to 00:00 on the 27th) there were 19 settlements: 6 at the baseline, 3 negative, +0.086% in total. The mark price rose from 111.11 to 121.35, up 9.2%.
ETFs buy spot, without leverage; funding reflects which side of the perpetual is more crowded. Both warmed up this week, but by very different amounts: the ETFs set a record, while the perpetual merely returned to around its baseline.
What it means for a balanced position
A balanced position earns funding, not price. SOL rose 9.2% this week; spot and perpetual cancelled, leaving only the week’s +0.086% in funding. Over the year it is −0.86%. SOL is the only major that has made shorts pay this year, and we have always kept that row in which coins suit funding rate arbitrage rather than dropping it.
What to watch
- Whether SOL’s negative periods cluster again. In February, 70 of 84 settlements were negative; that is what clustering looks like.
- Whether ETF inflows continue, and whether funding settles back onto its baseline.
- The gap between SOLUSDC and SOLUSDT. The USDC contract is at −0.19% for the year, 0.68 points less negative than the USDT one; why is in USDC vs USDT perpetual funding rates.
Sources: the 25 September net inflow of $86.67 million, BSOL’s $55.73 million, GSOL’s $18.47 million, net assets of $1.964 billion and cumulative net inflows of $1.605 billion are SoSoValue figures, from TokenPost, 2026-09-26, consistent with the $86.7 million in The Block; the $80 million to $87 million range and the previous $33.5 million record are from CoinNess, relaying Crypto Briefing; daily figures and the $188.1 million weekly total are from BigGo Finance; SOLUSDT, BTCUSDT, ETHUSDT, BNBUSDT and SOLUSDC per-period funding and mark prices come from Binance’s public USD-M endpoint fapi/v1/fundingRate, via our collection database, 2026-01-01 00:00 to 2026-09-27 00:00 UTC. Cumulative figures are sums of periods, not compounded. Tickers are shown to document the data, not as recommendations. Past data does not indicate future returns.