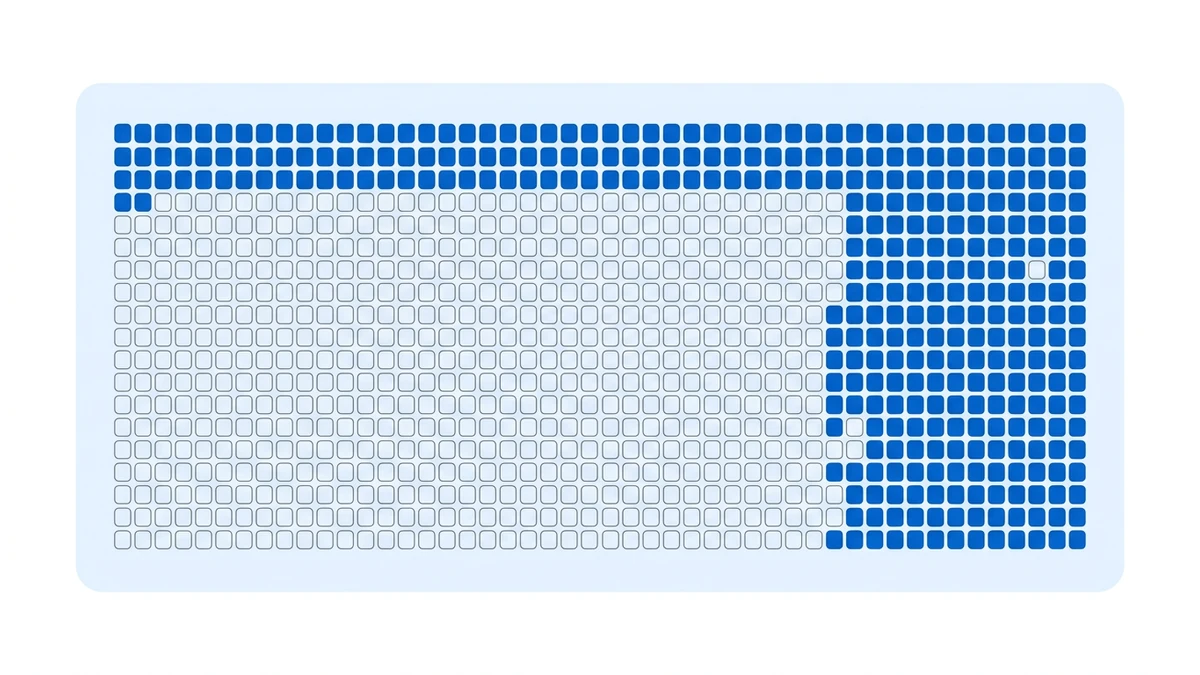
To judge what a funding-rate dataset can answer, check three things first: when each symbol’s data begins, which settlements are missing, and how many symbols are in the sample each year. The total record count matters least. Our own database is a good example. As of 2026-10-08 it holds 1,029,262 settlements across 534 symbols, yet every year from 2020 to 2024 contains only two of them: BTCUSDT and ETHUSDT.
A successful API request is not the same as complete data; we covered that in our coin-margined collector retrospective. This piece goes one layer further: once the data is stored, how do you tell which conclusions it can support?
When the sample changes, the average changes with it
| Year | Symbols | Settlements | Share positive | Average per settlement |
|---|---|---|---|---|
| 2020 | 2 | 2,194 | 91.52% | +0.0204% |
| 2021 | 2 | 2,190 | 94.29% | +0.0311% |
| 2022 | 2 | 2,190 | 71.87% | +0.0023% |
| 2023 | 2 | 2,190 | 90.37% | +0.0073% |
| 2024 | 2 | 2,196 | 93.72% | +0.0114% |
| 2025 | 460 | 300,090 | 68.59% | −0.0071% |
| 2026 (to Oct 8) | 534 | 718,212 | 75.63% | −0.0052% |
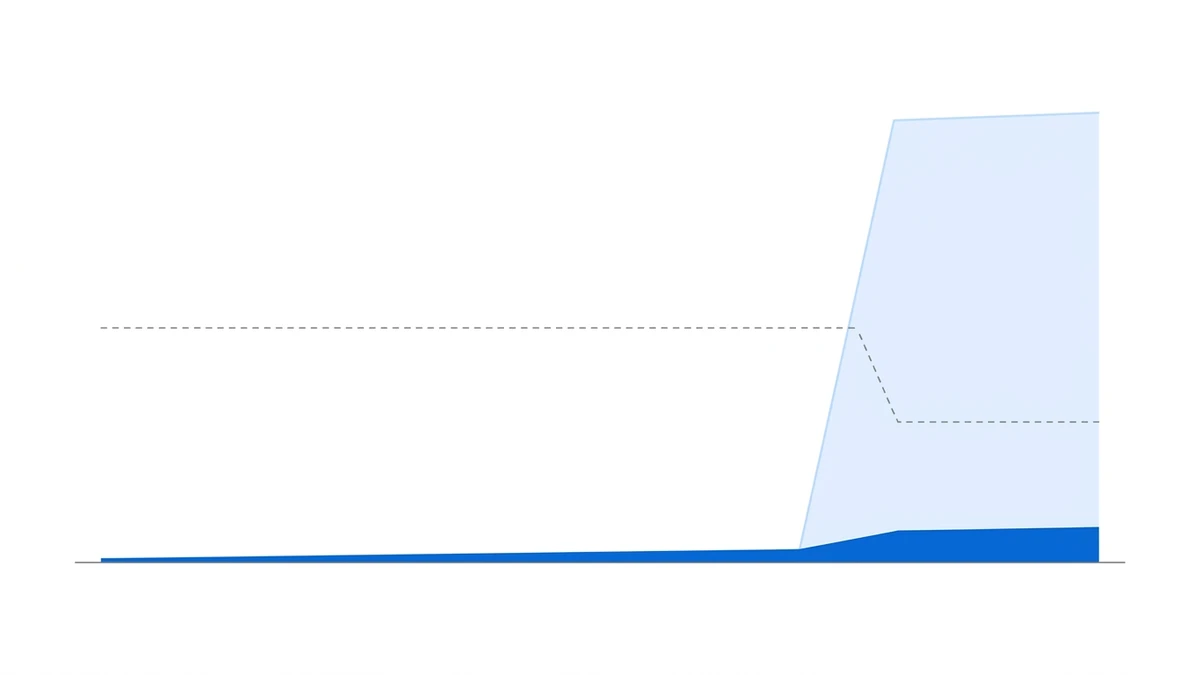
Reading only the last column, you would conclude that funding turned negative from 2025 onward. The second column says something else: the sample grew from 2 symbols to 460. Hundreds of newly added small caps pulled the average down; the market itself may not have changed. Looking only at the two long-history symbols, 85.95% of BTCUSDT settlements since 2020 were positive, and 86.22% for ETHUSDT.
Year-over-year comparisons must use symbols present in both years. Comparing an expanded market-wide dataset with the pre-expansion one compares two different samples.
Health checklist: write every item as a count, not as “OK”
- Market scope. Which market and contract type is being collected, and does the endpoint apply? Our own mistake: 19 coin-margined contracts were sent to a funding endpoint that only serves USDⓈ-M contracts. It returned an empty page and still reported success, so every 15 minutes the job “started” again and not a single row was stored, while the logs showed nothing but “collection started.”
- Outcome counts. Record candidates, out-of-scope exclusions, successful requests, records returned, rows actually written, and the latest settlement time per symbol. These have different units and cannot be added together.
- Coverage matrix. One row per symbol: first settlement, last settlement, actual count, expected count for the interval, known gaps. A contract that has existed for six years does not mean your database has six years of it.
- Source consistency. The same cell should agree across sources; when it does not, keep both and cite each. We have one ourselves: our yearly performance table marks the 2020 settlement count as unknown (that cell is a cumulative value inherited from an older dashboard and cannot be checked period by period), while the market-wide table records 2,194 settlements for 2020. Rather than deleting one, we show the discrepancy on the page.
- Statistics versus display. Our 30-day statistics include 529 contracts, four of which have non-ASCII tickers and count toward the totals but are left off the leaderboard. That difference is stated on the page; otherwise anyone checking totals against the leaderboard would find a mismatch.
- Remove delisted contracts promptly. A delisted contract left on the list errors every cycle and never recovers. We once had the same three errors repeat for three weeks.
Interpretation rules
- Multi-year trends need symbols with multi-year history. In our data, only BTCUSDT and ETHUSDT support a year-by-year narrative.
- For “this year versus last year,” first fix the sample to contracts with data in both years.
- Put a cutoff time on every number. Data is current as of the snapshot, not as of the moment a reader opens the page.
- If you cannot tell whether a gap means “no settlement happened” or “we did not collect it,” write “unknown” rather than zero.
How the yearly results are presented within these limits is shown in our six-year review and on the performance page. The market-wide distribution is in summing this year’s funding for 450 contracts, and live figures are on the funding rate data page. Data checks make conclusions easier to explain; they do not remove trading risk.