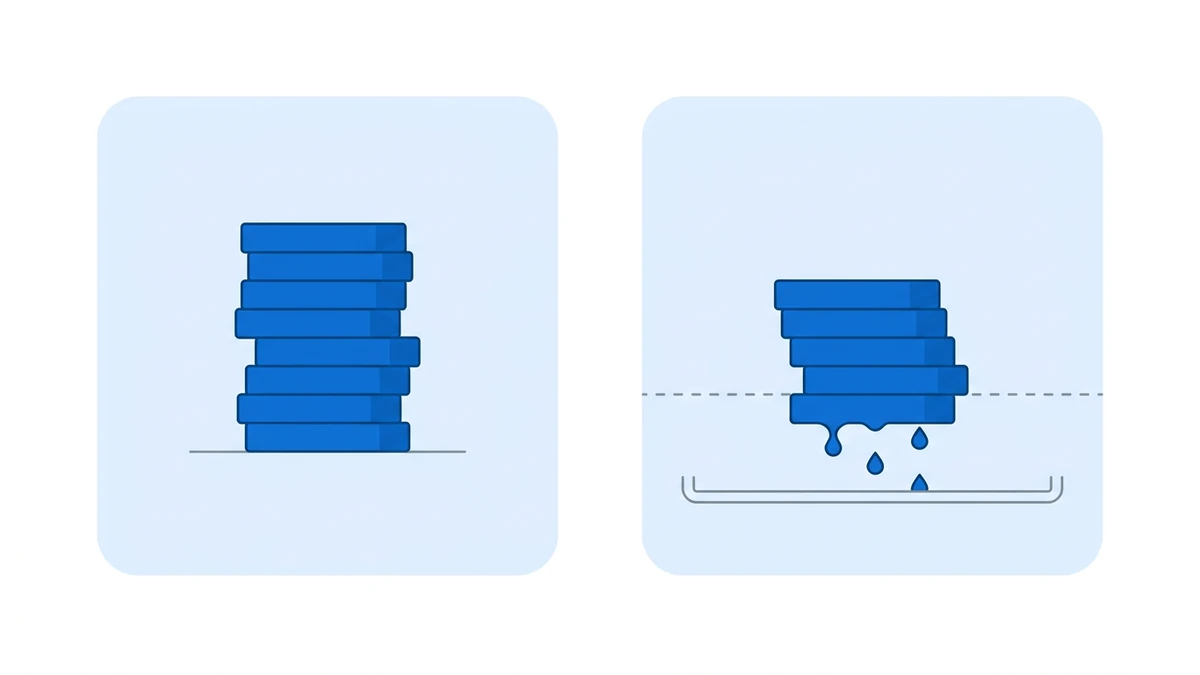
Matching the spot and perpetual legs removes price direction. It does not freeze the margin sitting in the futures account. That buffer can thin out in two ways: quickly, when a sharp rally pushes the short leg into a loss, and slowly, when funding turns negative and the short pays every settlement from the futures wallet while the spot leg contributes nothing. A margin review should track the two paths separately, with separate thresholds.
We already cover the liquidation-distance formula and the differences between margin modes elsewhere. This piece adds the slow path and a review table that leaves an audit trail.
The slow path: which account pays funding
In the usual long-spot, short-perpetual structure, the short receives funding when the rate is positive and pays when it is negative. Funding settles in the futures account, and gains on the spot leg are not swept across automatically. During a negative stretch, available margin in the futures account only moves one way. Price can sit still while the buffer shrinks.
This is easy to overlook because major pairs are positive most of the time. In our database, as of 2026-10-08, 85.95% of BTCUSDT’s 7,416 settlements since 2020 were positive, and 86.22% for ETHUSDT. “Most of the time” is not “every month.”
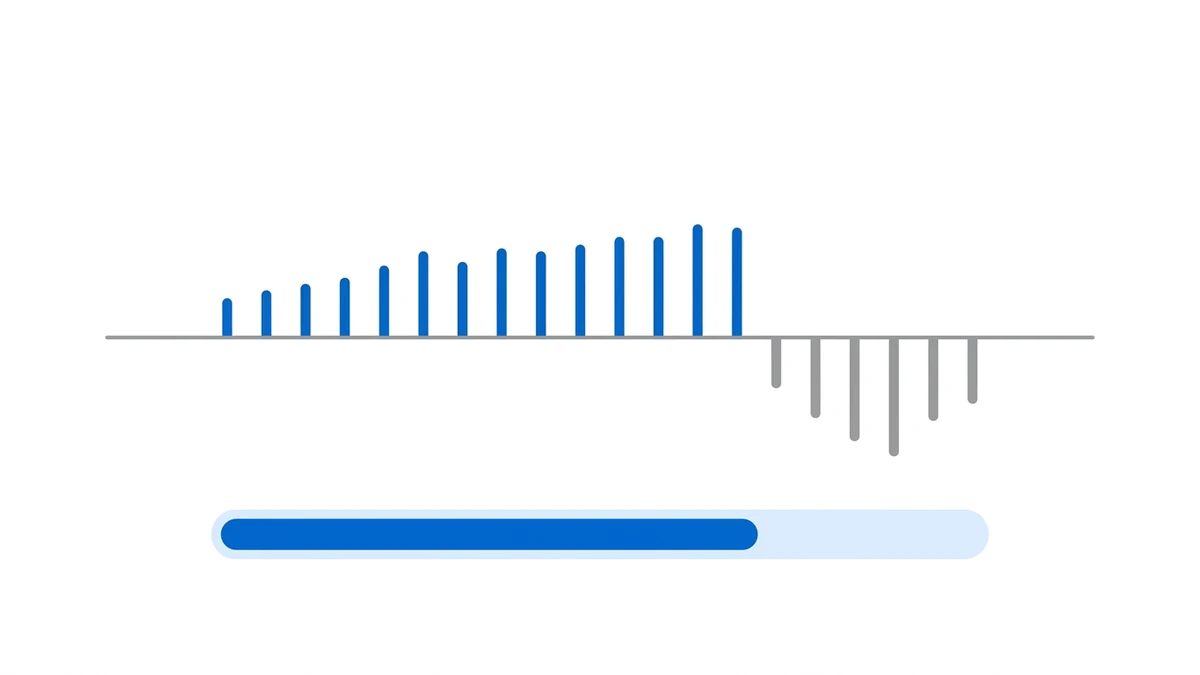
Three readings from our data
The table sums funding by period (simple addition, no compounding), with data through 2026-10-08. “3x notional” means the contract notional is three times the account’s margin; the last two columns convert each negative stretch into a share of that margin.
| Period | Symbol | Cumulative funding | Share of margin at 3x | Share of margin at 5x |
|---|---|---|---|---|
| Feb–Apr 2026 | BTCUSDT | −0.32% | −0.97% | −1.62% |
| Feb–Apr 2026 | ETHUSDT | −0.54% | −1.61% | −2.68% |
| Sep 2022 | ETHUSDT | −1.56% | −4.68% | −7.80% |
For major pairs the slow path costs a few percent of margin. Small caps operate on a different scale. In the 30 days to 2026-10-08, LSKUSDT settled 392 times for a cumulative −67.34%. At 3x notional that is 2.02 times the margin: without top-ups, the position would be liquidated long before the window ended.
Review table: every row needs a number and a timestamp
| Check | What to record | Why it matters |
|---|---|---|
| Account boundaries | Which account holds each leg, and the margin mode | Isolated margin only counts what was transferred in; cross and unified offsets need their own review |
| Fast-path buffer | Mark price, maintenance rate, liquidation price, distance to liquidation | A liquidation price is a snapshot, not a promise |
| Slow-path buffer | 30-day cumulative funding, number of negative periods, that total as a share of margin | Negative funding drains the buffer in one direction |
| Risk tier | Current tier for the notional and the next threshold | Adding size or a tier revision raises the maintenance rate |
| Top-up route | Source account, expected delay, who can authorize it | Transfers are not instant, and selling spot takes time to fill |
| Exit order | Which leg closes first, who handles a failed second leg | After one leg fills, the position is no longer neutral |
Setting thresholds
We do not suggest a universal percentage. Instead, set one line for each path. The fast line measures price distance to liquidation. The slow line measures negative funding over the last N days as a share of margin. The slow line often fires first, because it moves even when price does not.
Write down the response in advance as well: add margin, cut size proportionally, or close both legs. Adding margin means selling spot or transferring from another account, and both take time. On small caps with extreme rates, that delay is itself a cost.
How this fits with related articles
- The one-line liquidation distance formula: why matched legs still get liquidated
- Isolated, cross and unified margin produce three liquidation prices: choosing a margin mode
- How margin drifts after a big rally: rebalancing a delta-neutral position
- How long negative funding can last: the longest negative funding streaks
Year-by-year funding, including the weakest year, is on our performance page. This is a review framework, not investment advice. Hedging does not remove liquidation, liquidity or exchange risk.