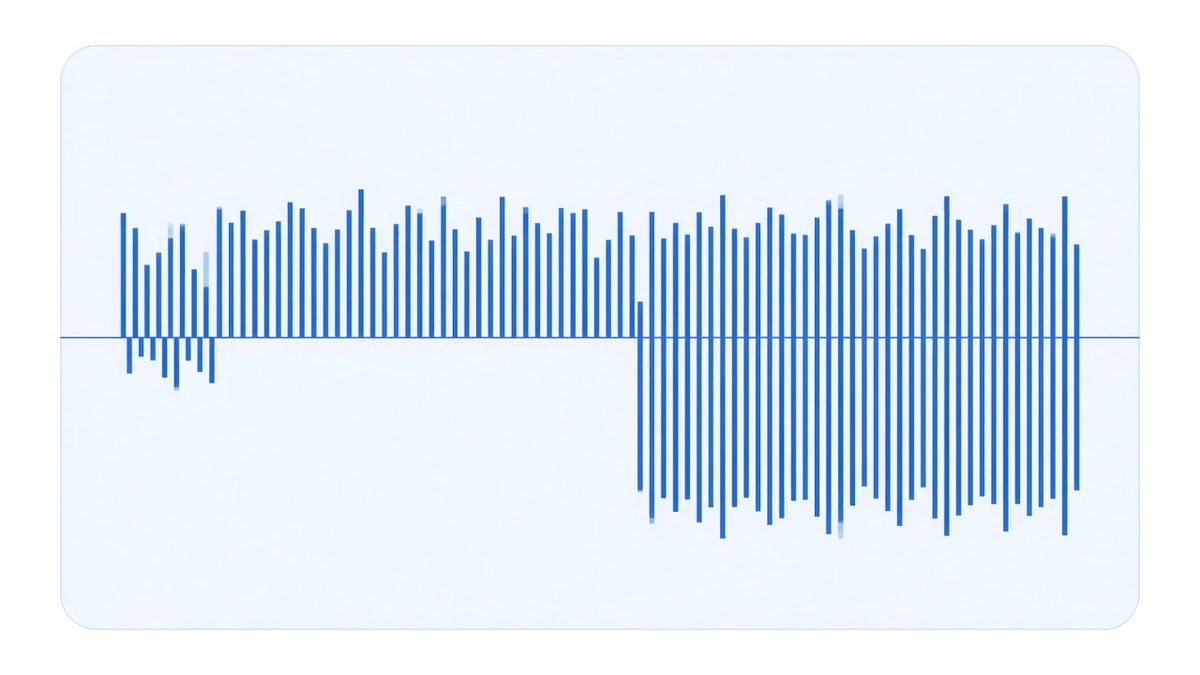
Someone asked a very concrete question: if funding just keeps going negative, does this thing simply bleed out?
Line up all 7,372 BTC settlements from six and a half years of our database, cut out every unbroken run of negative periods, and count them. The answer: the longest run is 24 periods — eight days, from 12 to 20 March 2020, cumulative −1.0372%.
That answer only holds for BTC. In the same database, BARDUSDT ran negative for 944 consecutive periods, cumulative −108.9583%.
What a negative run looks like on a major
BTC’s longest negative runs:
| Periods | Window (UTC) | Cumulative |
|---|---|---|
| 24 | 2020-03-12 → 03-20 | −1.0372% |
| 18 | 2024-09-08 → 09-14 | −0.0738% |
| 16 | 2020-03-28 → 04-02 | −0.4073% |
| 14 | 2026-04-17 → 04-22 | −0.0908% |
| 12 | 2026-05-04 → 05-08 | −0.0565% |
First and third both land in March 2020, the month every market broke at once. The second row is the interesting one: September 2024 dragged on for 18 periods, six days, and cost a grand total of −0.0738%. Duration and cost are two separate things and have to be read separately.
ETH’s longest run beats BTC’s by one period: 25 periods, 8 to 16 September 2022, cumulative −1.3535%. That window wraps around the Ethereum Merge.
For contrast, BTC’s longest positive run is 541 periods, from 21 October 2023 all the way to 18 April 2024 — a hundred and eighty days unbroken, cumulative +9.2517%. The two lengths are not in the same league.
Most negative funding lasts exactly one period
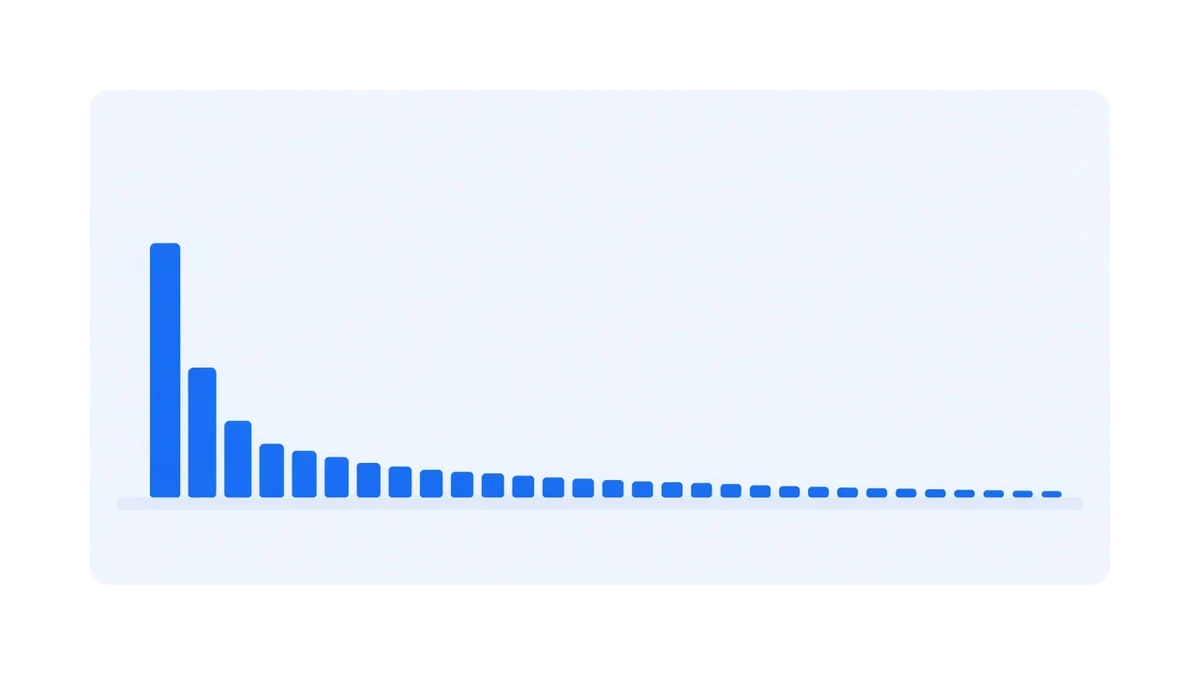
BTC’s 1,032 negative settlements are spread across 484 separate runs. By length:
- 288 runs are a single period (59.5%)
- 88 runs of two, 48 runs of three
- 14 runs of eight or more
- Only 5 runs of twelve or more
So funding turning negative is not rare at all — it happened nearly five hundred times in six years. What is rare is it persisting. Only 35 runs lasted longer than a day and a half (five periods), 7% of all negative runs.
The share of negative periods by year varies more than you would expect:
| Year | BTC negative | ETH negative |
|---|---|---|
| 2020 | 14.30% | 2.64% |
| 2021 | 7.31% | 4.11% |
| 2022 | 22.10% | 34.16% |
| 2023 | 10.14% | 9.13% |
| 2024 | 8.38% | 4.19% |
| 2025 | 12.88% | 16.16% |
| 2026* | 26.26% | 31.03% |
* 2026 to 23 September, 796 settlements.
2026 is the highest year on record for BTC — higher than the 2022 bear market. That number does not flatter us. It is in the table anyway.
The small-cap column is a different world
Rank all 450 symbols in the database and the negative-streak leaderboard looks like this:
| Symbol | Periods | Window | Cumulative |
|---|---|---|---|
| BARDUSDT | 944 | 2026-03-04 → 04-22 | −108.96% |
| COTIUSDT | 733 | 2026-08-02 → 09-07 | −58.70% |
| ENJUSDT | 617 | 2026-03-17 → 05-14 | −72.88% |
| SENTUSDT | 616 | 2026-01-29 → 02-24 | −110.50% |
| HOMEUSDT | 477 | 2026-05-31 → 06-23 | −117.03% |
The exchange had moved these contracts to hourly settlement, which is why the period counts stack up so fast. But convert to days and they are still four to seven weeks of continuous negative funding. HOMEUSDT’s −117.03% over 23 days means a spot-long / perpetual-short book would have paid away more than the position itself on funding alone.
The coins at the top of the funding leaderboard and the coins in this table are largely the same set. High funding and deep negative funding are two faces of one thing: both sides crowded, and no spot market deep enough to pull the spread back.
What this means for a balanced book
When funding is negative, a spot-long plus perpetual-short book is the side paying. The directional exposure is still balanced, price moves still do not matter, and it does not get liquidated over this — what actually happens is that the cash flow reverses.
So the question is not “can this blow up”, it is “how long and how much do I pay”. Three numbers settle it:
- Longest run. Eight days for BTC over six years — that is waitable. Seven weeks on a small cap is not a waiting problem.
- Cumulative depth. BTC’s worst run was −1.0372%, which a single quarter of positive funding covers. A small cap’s −100%-ish run has nothing that covers it.
- Frequency. Of BTC’s 484 negative runs in six years, only 35 exceeded five periods.
This is why symbol selection matters more than chasing the highest rate. Trading a headline rate three times higher for a seven-week negative window does not pencil out on any arithmetic.
The thing people get backwards
Negative funding does not mean losing money, and positive funding does not mean making it. What counts is the cumulative figure over the window, minus costs.
That September 2024 run dragged for six days and sounds unpleasant; it cost −0.0738%. The eight days in March 2020 cost −1.0372%, averaging −0.043215% per period — four or five times a typical negative period. Both are “about a week of negative funding”. The bills differ by a factor of fourteen.
What negative funding actually is, and whether you can run the trade in reverse, is covered elsewhere. This piece only answers the duration question.
Data and as-of
From the per-settlement records in our FundingRateTicks table, as of 2026-09-23 00:00 UTC: 900,260 settlements across 450 symbols; BTCUSDT and ETHUSDT 7,372 each, going back to 2020-01-01. Runs are cut on “rate strictly below zero”; periods that land exactly on zero are not counted as negative. Year-by-year performance is whatever /performance/ says.
A record from a historical window is only a record. It sets no ceiling, and the next run can be longer than eight days.