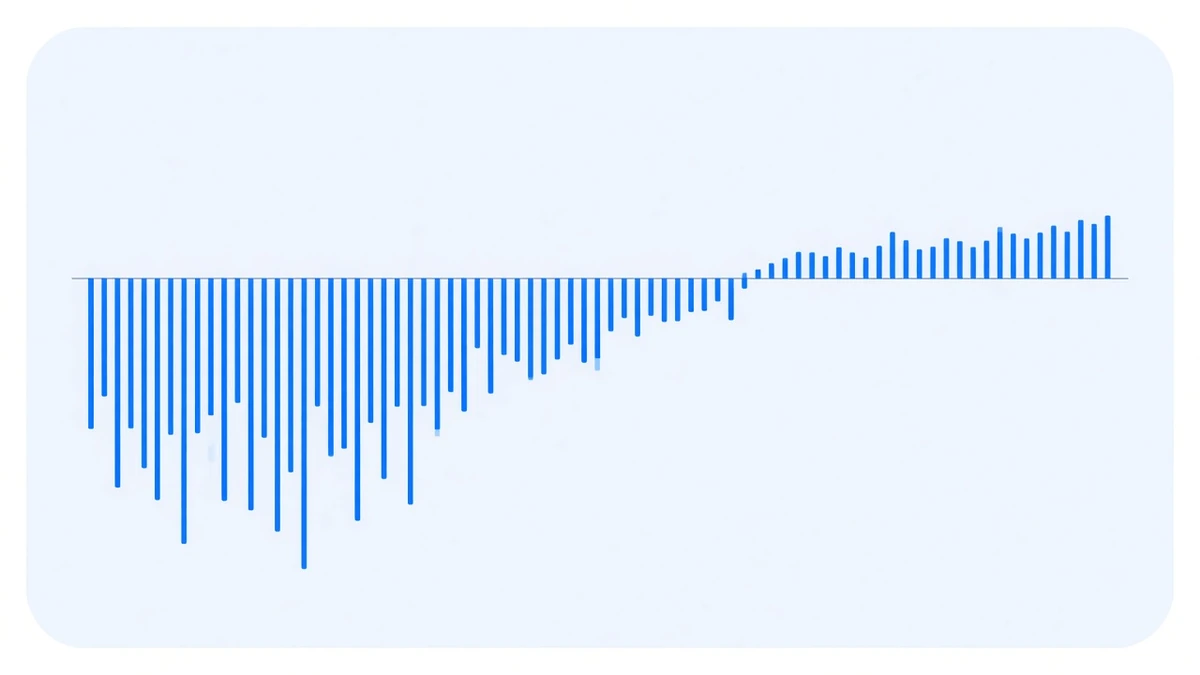
In the first days after a perpetual lists, it tends to stand out on the funding leaderboard. The natural assumption follows: attention is concentrated, longs are crowded, funding should be unusually high.
Pull the 78 symbols in our database that first appeared after September 2025 and survived at least 120 days, and the result runs the other way. Over their first thirty days, 43 of them accumulated negative funding — 55.13%. Mean −4.5396%.
Negative funding means a spot-long plus perpetual-short book is not the side collecting. It is the side paying.
Defining “newly listed” properly
Get this step wrong and everything after it is wrong.
Our collector expanded to the whole market in August 2025, and 363 symbols “first appeared” that month. Almost all of them had been listed on the exchange for a long time; we had simply started recording them. Treating those as new listings produces a number that means nothing.
So the filter is: first appearance after 2025-09-01 (skipping the rollout batch), and survival past 120 days (enough follow-on data for a comparison). That leaves 78.
Which is also why no “450 symbols” headline appears below. Only 78 of them can support this question.
What the first thirty days look like
Cumulative funding over the first thirty days, 78 symbols:
| Measure | Value |
|---|---|
| Mean | −4.5396% |
| Median | −0.5452% |
| 10th percentile | −19.7446% |
| 90th percentile | +4.5900% |
| Minimum | −39.6757% (ESPUSDT) |
| Maximum | +8.2915% |
| Negative cumulative | 43 / 78 (55.13%) |
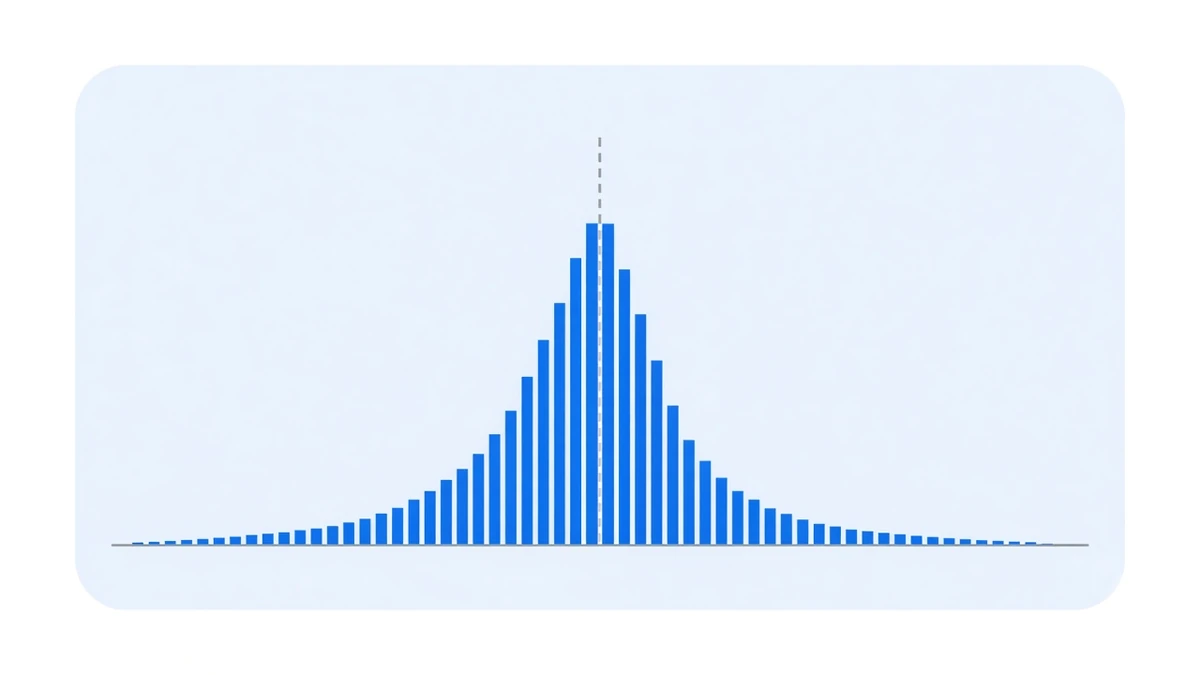
A mean of −4.54% against a median of only −0.55% is itself part of the finding: the mean is being dragged down by a handful of extremes. A tenth of the symbols came in below −19.74% in month one, and that small group alone pulls the group mean to −4.5%.
Read only the mean and you conclude “new contracts are all negative”. Read only the median and you conclude “new contracts are fine”. Both are wrong. The accurate reading is that most new contracts are mildly negative in month one, and a minority are catastrophically negative.
It normalises with age
Split the same 78 symbols by days since listing and look period by period:
| Phase | Settlements | Mean per period | Negative share | Median per period |
|---|---|---|---|---|
| Days 1–30 | 16,362 | −0.021641% | 33.04% | +0.005000% |
| Days 31–90 | 30,773 | −0.013593% | 26.46% | +0.005000% |
| Day 90 onward | 99,524 | −0.005219% | 16.57% | +0.005000% |
The median period is identical in all three phases, +0.005%. Two things move: the negative share falls from 33.04% to 16.57%, and the mean converges from −0.0216% toward −0.0052%.
The paired comparison is even more direct — the same 78 symbols against themselves:
- First 30 days: mean −4.5396%, median −0.5452%
- Days 90–120 (same 30-day length): mean −1.7300%, median +0.7884%
The median flips from negative to positive and the mean’s hole is half as deep. Same coins, same window length, three months later.
Why new contracts skew negative
Negative funding means the perpetual is trading below the spot mark price and the clamp is pushing the other way. New contracts happen to have several conditions that keep them at a discount:
First, the spot leg is often not in place. When a contract lists, the matching spot book is usually far thinner than the perpetual, so arbitrageurs who would close the gap cannot source enough spot to do it.
Second, shorts are crowded. Selling pressure concentrates early in a listing, and because the coin often cannot be borrowed for a spot short, every short expresses itself in the perpetual. That pushes the perpetual below spot and funding turns negative.
Third, exchanges frequently set new contracts to hourly settlement. That does not change the size of a single period, but it multiplies the rate of accumulation by eight — the piece on moving settlement from 8 hours to 4 makes the point that this cuts both ways. When funding is negative, it amplifies in the direction that hurts.
What about the high-funding new listings at the top
They exist. The best first-thirty-day totals land between +5% and +8.29%, which annualises into a large number.
The problem is that on listing day you do not know which one you are holding. Within the same 78, the best was +8.29% and the worst −39.68%, and the negative half is the larger half. That is not a favourable lottery.
The leaderboard piece worked out that much of the headline annualised figure at the top comes from settlement count rather than per-period rate. The negative-streak piece shows the same cohort running negative for four to seven weeks at a stretch. Put the three tables together and they point the same way.
So we do not chase new listings
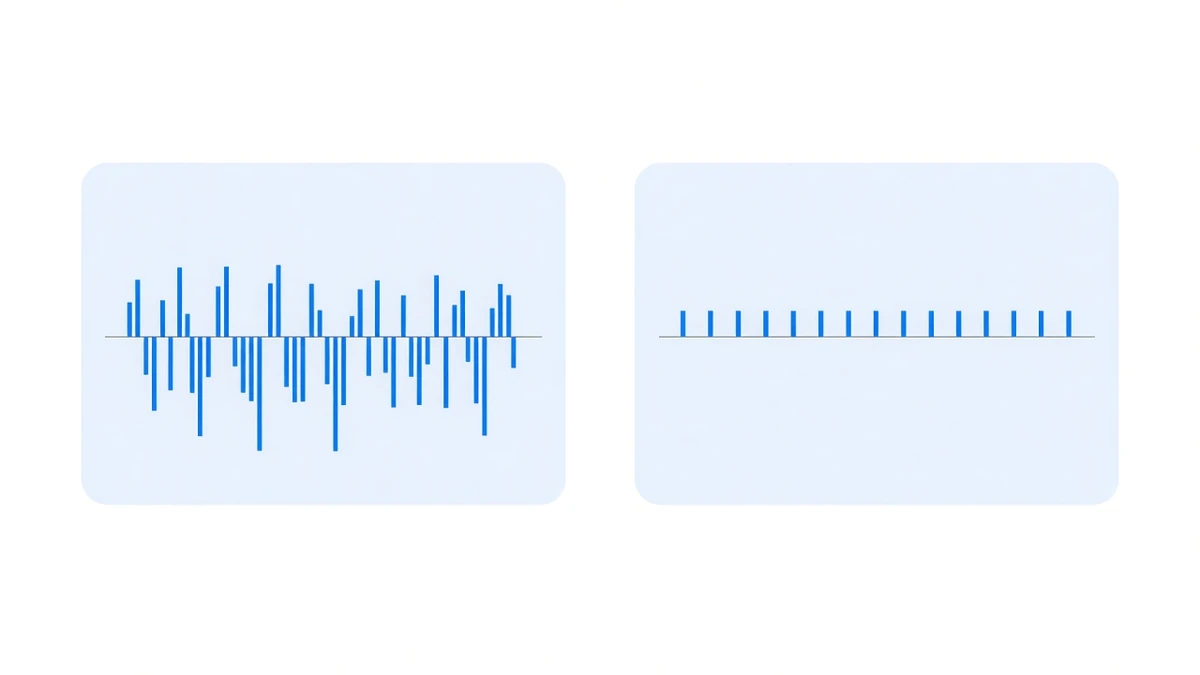
This is not a stylistic preference, it is what the capacity arithmetic returns. Spot depth on a new contract will not support much size, and at the size it will support, there is roughly a coin-flip chance of paying rather than collecting for the first thirty days. Multiply the two and there is nothing there.
The practical move is to wait. In the phase table above, the negative share past day 90 falls to 16.57%, already close to BTC’s year-by-year level. Whether a contract belongs in a book is a far more answerable question three months in than on listing day.
Data and conventions
From the per-settlement records in our FundingRateTicks table, as of 2026-09-23 00:00 UTC. The sample is the 78 symbols whose first record falls after 2025-09-01 and whose first and last records are more than 120 days apart.
One limitation worth stating: “first appeared in our database” is not exactly “listed on the exchange”. We have excluded the collector rollout batch, but a few symbols may have entered coverage for other reasons. That would mix some established contracts into the sample, which would bias the first-thirty-day numbers toward looking better than reality, not worse.
Year-by-year performance is whatever /performance/ says. A historical cross-section implies nothing about any particular contract.