On 7 October 2026 the US 10-year Treasury yield reached 5.361% intraday and the 30-year 5.730%, both the highest since 2002. Risk assets sold off with it: bitcoin fell 2.7% to $83,336, ether 5.2% to $2,559, and XRP 5.5% to $1.42.
The macro half has been written up everywhere. This covers only the question our own data can answer: on days like this, who is actually paying whom in the perpetual market.
Correcting a default assumption
The most repeated line about perpetuals is that longs pay shorts. For BTC it holds. As of 2026-10-08 06:00 +08:00, BTC perpetuals have settled 7,416 times since January 2020, 85.95% of those periods carried a positive rate, and the full-period mean is +0.010681%. ETH is nearly identical at 86.22% positive.
Widen the lens to the whole market and it inverts.
The same snapshot covers 534 symbols and 1,029,262 settlement records. Broken out by year:
- 2025: 460 symbols, 300,090 periods, 205,842 of them positive (68.59%), full-year average −0.007055%
- 2026 to date: 534 symbols, 718,212 periods, 543,161 positive (75.63%), average −0.005227%
Two consecutive years in which the market-wide average funding rate is negative.
Three quarters positive, average negative
Those two figures are only interesting together.
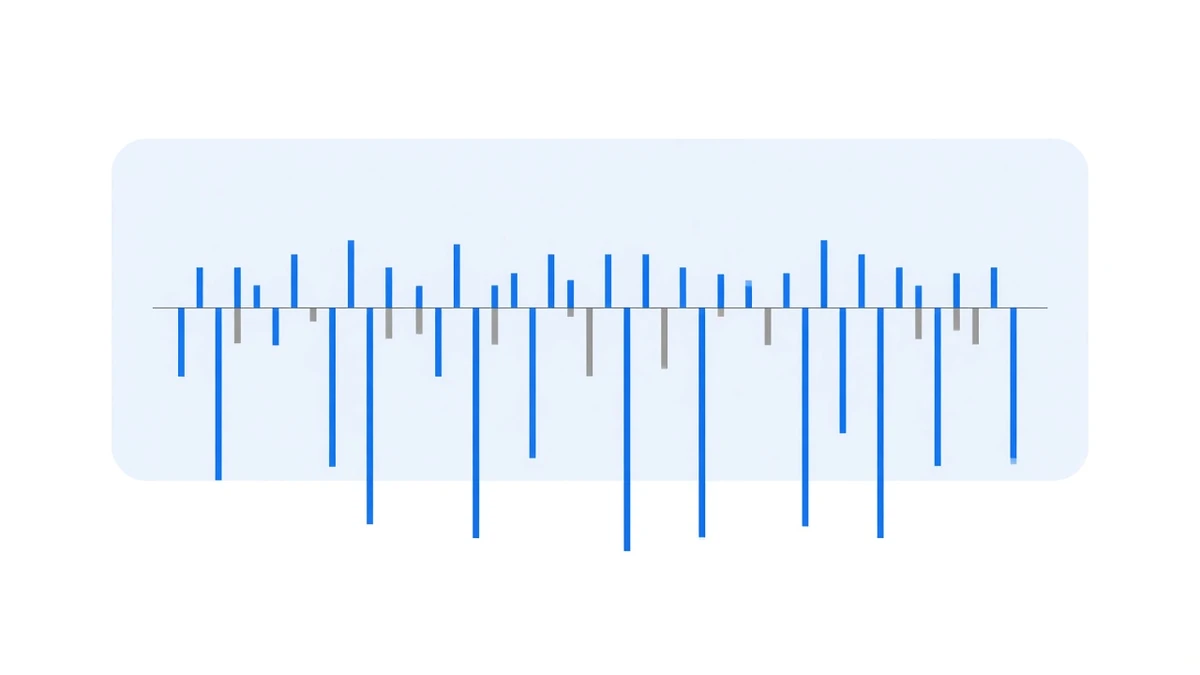
Most periods positive but the mean negative can mean only one thing: the negative periods are much larger per period. Positive funding is mostly small amounts hugging the baseline, while negative funding concentrates in a handful of violently imbalanced moments and a handful of instruments, and one of those can wipe out hundreds of positive periods.
That is the real shape of market-wide funding — not a curve oscillating symmetrically around zero, but a distribution that is mildly positive most of the time with an occasional deep negative tail. We sorted this year’s cumulative values across contracts previously and found a median of −0.56%, with 244 of 450 negative — the cross-sectional view of the same fact.
So what about a day like 7 October
A macro-driven selloff is exactly when negative funding tends to cluster: longs deleverage, the perpetual moves to a discount against spot, and the rate follows it down.
What can be confirmed so far is the monthly reading. BTC perpetual funding totalled 0.060452% over the seven days from 1 to 8 October, ETH 0.079555% on the same basis (summed period by period, as of 2026-10-08 06:00 +08:00). For comparison, BTC logged 0.456151% across all of September and 0.613952% in August. The daily run-rate for these seven days is visibly below the previous two months.
The 30-day cross-section is still tilted positive, though: of the 529 symbols that qualify for the window, 444 are cumulatively positive. This week’s pullback has not yet changed the direction at a one-month horizon.
What it means for a hedged book
A balanced book does not care how far price falls, only whether funding turns negative and for how long. Three things follow from the data above:
- On BTC and ETH, negative funding is the minority case — but it has run eight consecutive days.
- On most mid- and small-cap instruments, negative funding is the norm rather than an accident. Extrapolating BTC’s 85.95% onto a newly listed name will mislead you.
- The policy rate is a separate line of the same ledger. With the 10-year at 5.361%, whether a funding-only book is worth running requires subtracting the risk-free rate first — we worked that through in what is left after subtracting the risk-free rate.
What to watch next
- Whether BTC’s October total returns to the 0.4% monthly order of magnitude. If it does not, the deleveraging is not finished.
- The share of instruments running negative. Currently 85 of 529 over 30 days; that ratio rising is the signal that matters.
- The rates side. The Treasury scheduled three auctions this week, including a $39 billion 10-year. Auction results feed straight back into yields.
No forecast here, only observable indicators. Funding approaching zero or turning negative in flat and bearish markets is a condition this strategy genuinely meets — the 2022 row on our performance page is where that came from. It did not happen this week, which does not mean it will not happen next.
Sources: Treasury yields and crypto prices from public market reporting on 2026-10-07 (10-year 5.361% intraday and 30-year 5.730%, both highest since 2002; BTC −2.7% to $83,336, ETH −5.2% to $2,559, XRP −5.5% to $1.42), with the yield readings cross-checked across NBC News, FXStreet and Yahoo Finance in agreement; the $39 billion 10-year auction size comes from the same reporting. All of our funding figures come from the backend period-by-period snapshot as of 2026-10-08 06:00 +08:00, summed period by period. Past data does not indicate future returns.