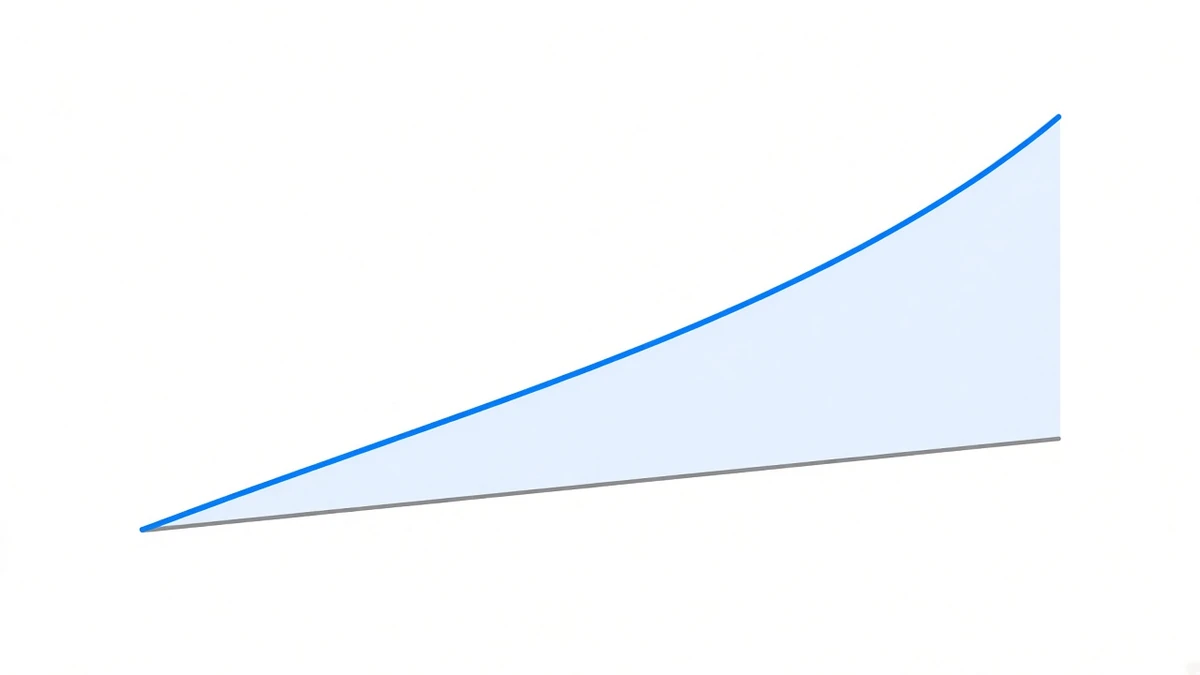
When you see an annualised number, ask one question first: does it assume you reinvested everything you were paid?
That question decides which of two very different results you get out of one set of data. Not “roughly the same” — genuinely far apart. Our BTCUSDT settlement history across seven calendar years comes to 80.109771% added and 108.44294% compounded.
Neither figure is a mistake. They answer two different questions, and only one of those questions corresponds to money you actually receive.
Separate the two conventions first
- Adding (simple, APR): sum the percentages period by period. The implicit assumption is that notional never changes — funding is paid out and does not take part in the next period.
- Compounding (APY): treat each period as a growth factor and multiply. The implicit assumption is that every payment goes straight back into the position, and the next period is collected on the larger notional.
The difference is not in the formula. It is in something that either did or did not happen in the real world: did that money go back into the principal.
One period of 0.01% supports two answers
Take the cleanest case: settlement every 8 hours, exactly 0.01% per period, 1,095 periods in a year.
| Convention | Calculation | Result |
|---|---|---|
| APR (added) | 0.01% × 3 × 365 | 10.9500% |
| APY (compounded) | (1 + 0.0001)^1095 − 1 | 11.5714% |
A gap of 0.6214 points. Not one number changed, not one period changed — swapping an assumption produced more than five percent more relative return.
And that is the small end of it. The denser the settlement and the longer the horizon, the wider the two spread.
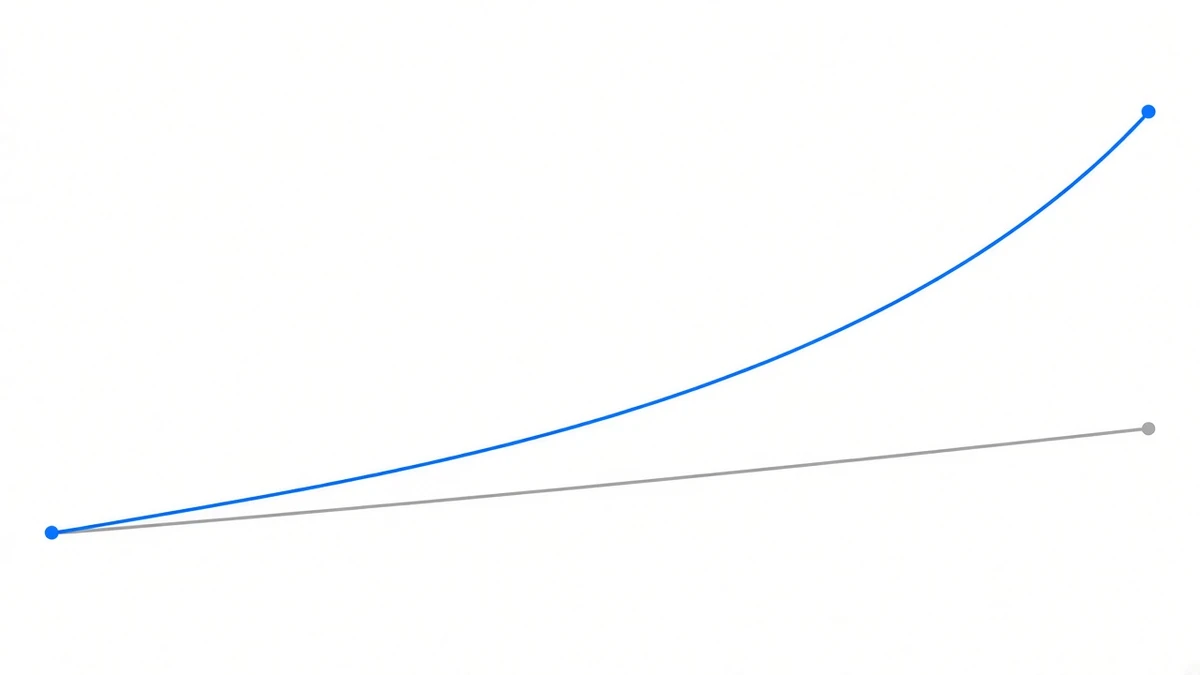
Seven years: 28 points
Run the same settlement series both ways (back-office snapshot, as of 2026-08-25 13:42 UTC):
| Symbol | Seven years added | Seven years compounded | Gap |
|---|---|---|---|
| BTCUSDT | 80.109771% | 108.44294% | +28.333 points |
| ETHUSDT | 97.082362% | 136.427887% | +39.346 points |
Taking the compounded column to market is tempting: the ETH row goes from “did not quite double in seven years” to “more than doubled in seven years.” Both columns come from the same data.
The counter-intuitive step: the bigger total has the smaller annual figure
Convert each column into an average per year and something surprising turns up:
- Arithmetic mean of the added convention: BTC 11.444253% per year
- Annual rate implied by the compounded total (CAGR): BTC about 11.06% per year
The larger total produces the lower annual rate. CAGR penalises volatility: for the same average, the bumpier the years, the lower the geometric mean. And these years have been bumpy — BTC’s best year was 2021 at 30.635167%, this year is a single digit so far, and the standard deviation on the yearly table is 9.449693.
Which makes “compounded total plus added annual average” the single most flattering combination and the one that should never appear. Each number is correct on its own. Put them on the same page and the page is lying.
So which one is right
Follow where the money goes, not which number looks better.
This system builds positions through manual commands and does not auto-reinvest; returns are paid out per plan as annual, quarterly or monthly distributions rather than rolled into principal. Principal is constant, so gross return is the same each year, strictly linear.
Our performance figures therefore use the added convention throughout. The compounded numbers exist only in the snapshot as a cross-check and never reach a page. Put the other way round: writing it as compound interest would be the fabrication — that requires the extra assumption that the investor puts every distribution back in, and no such clause exists.
The test is simple:
- Return stays in the position and the next period is collected on the larger notional → compounding is right.
- Return is withdrawn or distributed to you → adding is right.
There is no third case, and “the industry convention is compound” is not a reason.
We tripped over this ourselves
An earlier version of the main site copy carried the compounded value from the old dashboard: BTCUSDT 2021 reported as 35.83%. Adding up the same settlement series gives 30.635167%.
Nobody faked those five-odd points. Two conventions sat next to each other and were never reconciled. The header of that snapshot file now says, in as many words, that the compounded figures are for cross-checking and must never be presented as performance — because this class of error never throws an exception. It just quietly raises the number.
Writing our own instance down matters, because the three questions below depend on it.
Checking somebody else’s annualised figure: three questions
- Is this added or compounded? If they cannot answer, the problem is not the convention. They do not know where the number came from.
- If compounded, does the return actually convert into principal? Is that clause in the terms? If it is not, the compounding is an assumption with nothing behind it.
- Are the annual figure and the cumulative figure on the same convention? This is the “compounded total, added average” mix from above, and it is the hardest one to spot.
None of the three requires them to disclose positions. They only require them to say what they are computing.
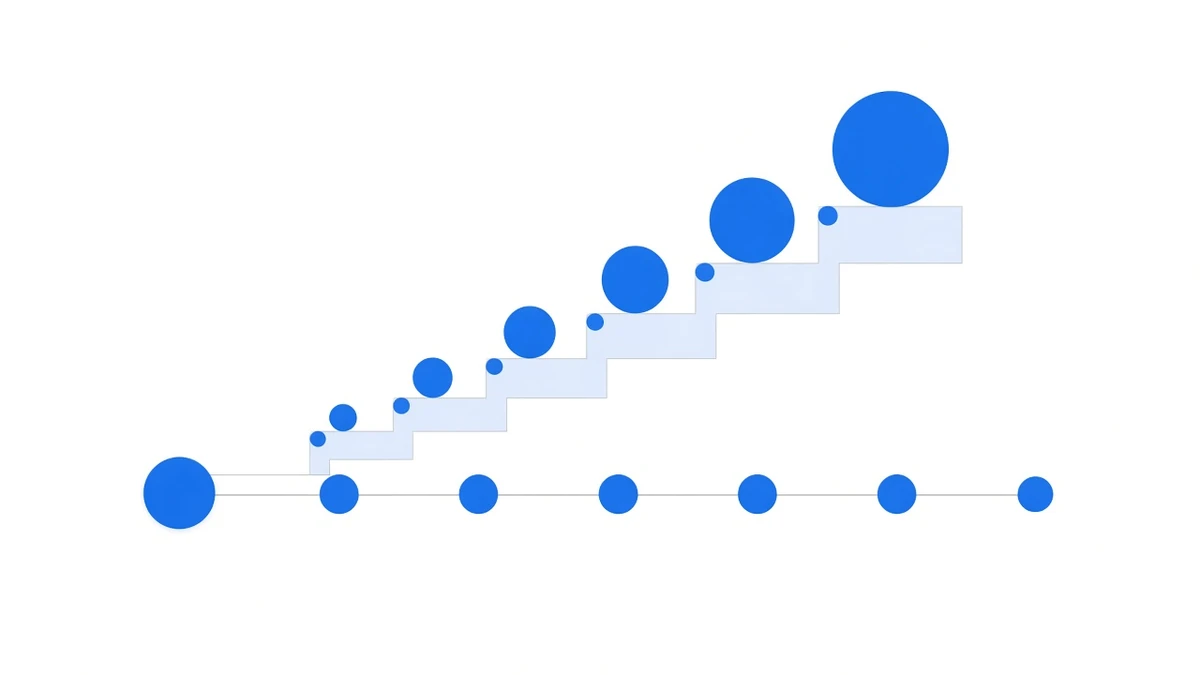
This year the two conventions almost coincide
Re-pulling this year’s settlements from Binance’s public USDT-margined futures endpoints (read 2026-09-20 14:11 UTC, covering 788 periods from 01-01 through 09-20 08:00 UTC):
| Symbol | Year to date | Annualised (added) | Annualised (compounded) |
|---|---|---|---|
| BTCUSDT | +2.091425% | 2.910% | 2.922% |
| ETHUSDT | +1.265904% | 1.761% | 1.766% |
| BNBUSDT | +2.059435% | 2.865% | 2.877% |
| SOLUSDT | −0.960962% | −1.337% | −1.335% |
The two columns essentially overlap, less than a tenth of a point apart.
Which explains exactly where those 28 points came from: the convention does not create return, it magnifies return that already exists. In a year when the return is small, every method gives a small number. Only over high-return, long horizons can compounding make the figure look good — and a long cumulative chart is precisely what a prospective customer is most likely to be shown.
Worth noting in passing: that SOLUSDT row is negative, with 390 of the 788 periods paying money out. Which coins suit funding rate arbitrage works through the period-by-period arithmetic for all four major symbols.
Net of costs is yet another layer
Everything above is still the gross rate. Between gross and what lands in your account sit four costs, the annual management fee and the profit split — the annualised figure a calculator gives you is five steps from what you receive takes those apart.
All three plans carry a flat 2% annual management fee deducted from returns, with nothing charged to the investor separately; in a year where returns cannot cover it, the platform collects less. Plan one offers a 7% floor on the net-of-fees figure with all excess going to the platform; plans two and three do not guarantee returns and split the excess. Terms are governed by the plans page, and funds are held in a dedicated platform account, which carries platform credit risk.
That 7% floor has to be read with the same ruler: it is an annual, net, simple-interest number, not a compounded one. Put it beside this year’s 2.910% and the gap between them is what the platform is carrying — and because it is a commitment rather than a projection, what stands behind it is platform credit rather than the market.
To finish the thought properly: funding goes to zero and turns negative, and the 0.787256% ETHUSDT line for 2022 on the track record page is how that happened. Whichever convention you use, that year looks bad.
Sources: yearly totals, the full-period statistics on both conventions and the standard deviation come from the back-office settlement snapshot (as of 2026-08-25 13:42 UTC) and are shown on the track record page; this year’s 788 settlement periods come from Binance’s public USDT-margined futures endpoints (read 2026-09-20 14:11 UTC, covering 2026-01-01 through 09-20 08:00 UTC); plan terms per the plans page. Past performance does not indicate future results, and this is not investment advice.