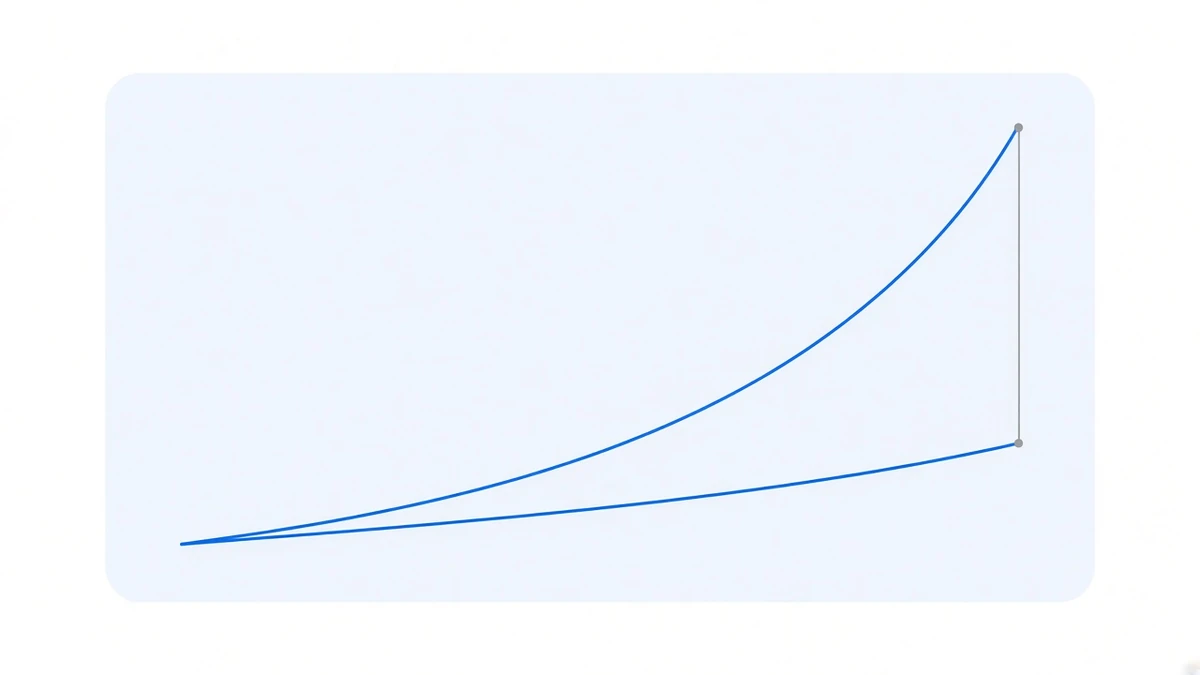
Take one set of per-settlement funding data, run it through two different arithmetic conventions over six and a half years, and you get two very different numbers:
- Summed period by period: BTC 79.1022%, ETH 93.3249%
- Compounded period by period: BTC 120.5202%, ETH 154.1913%
That is a 41.4 point gap on BTC and 60.9 on ETH. Both come from the same table and the same 7,372 settlements. Neither is a calculation error.
We publish the smaller one. Not out of conservatism.
Compounding describes an account that never existed
What the compounded convention actually asserts is this: every time funding is received, it is immediately added back into the position to earn more. The next period’s rate then applies to a larger base.
Doing that requires a whole chain of conditions: an automatic order every eight hours the moment funding credits, both legs scaled up simultaneously and kept balanced, no fee or slippage on the top-up, and spot depth waiting on the other side to absorb it.
Positions in this system are opened by hand. There is no automatic reinvestment. So that 120.5202% describes a position that has never existed — it assumes an action we do not take.
Putting an action you did not take into your performance figure is not a question of conservative versus aggressive. It is a question of right versus wrong.
Year by year, where the gap hides
| Year | BTC summed | BTC compounded | Gap |
|---|---|---|---|
| 2020 | 17.2397% | 18.8083% | 1.57 |
| 2021 | 30.6084% | 35.7935% | 5.19 |
| 2022 | 4.1649% | 4.2524% | 0.09 |
| 2023 | 7.8657% | 8.1828% | 0.32 |
| 2024 | 11.9569% | 12.6995% | 0.74 |
| 2025 | 5.1264% | 5.2599% | 0.13 |
| 2026* | 2.1401% | 2.1630% | 0.02 |
* 2026 to 23 September, 796 settlements.
Within any single year the two conventions barely differ. 2022 is 0.09 points apart, 2026 is 0.02. That is because a single funding period is tiny to begin with — BTC’s quartiles are 0.002732% / 0.009131% / 0.010000%, so nine periods in ten sit below a tenth of a percent. Compounding something that small, period by period, is invisible over one year.
The gap does not live in the periods. It lives between the years. The seven annual gaps are 1.57, 5.19, 0.09, 0.32, 0.74, 0.13 and 0.02, which add to 8.06. The full-window gap is 41.4. The extra thirty-plus points come entirely from the assumption that last year’s earnings keep earning this year.
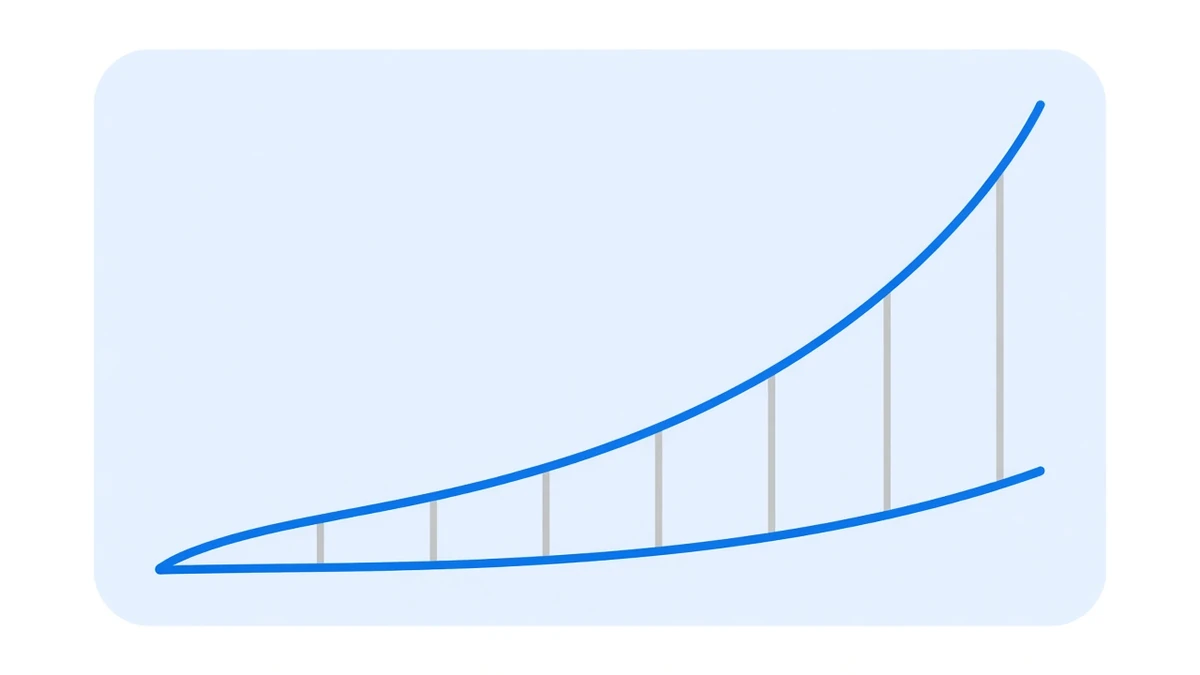
Put differently: those 41 points are not “funding was higher”. They are “you withdrew nothing for seven straight years, and every top-up was frictionless”.
A mistake that actually happened here
This is not an abstract discussion about conventions. The early copy on our own main site used the compounded figure: BTCUSDT 2021 was reported as 35.83%, while the same per-settlement data summed to 30.635167%.
Nobody faked that number. It was simply the legacy dashboard’s default output, and when it was copied across nobody asked how it had been computed. A five-point discrepancy sat on a live page for a while. It only surfaced when the data pipeline was rebuilt and both conventions were computed side by side.
The backend now calculates and stores both, but performance uses the summed figure only; the compounded value exists as a reference. The header of the file that generates the snapshot records the whole history, for whoever edits it next.
Why this deserves its own article
Because it is the single most common move in investment marketing.
Take a real underlying dataset, roll it forward under an assumption that is technically valid but operationally impossible, and land on a much prettier number. Not one word of it is false.
It is the same family of manoeuvre as how an annualised figure gets inflated: the same funding series written as APR or APY can differ by 28 points. The difference is that annualising stretches a short reading out, while compounding stacks a long reading up. Layer both and a 2% year can be written as a double-digit number.
So when you check the returns a platform reports, the first question is not “how much” but “how was this computed”. Two specifics: summed or compounded? Is the reinvestment real or assumed?
Can you actually compound it
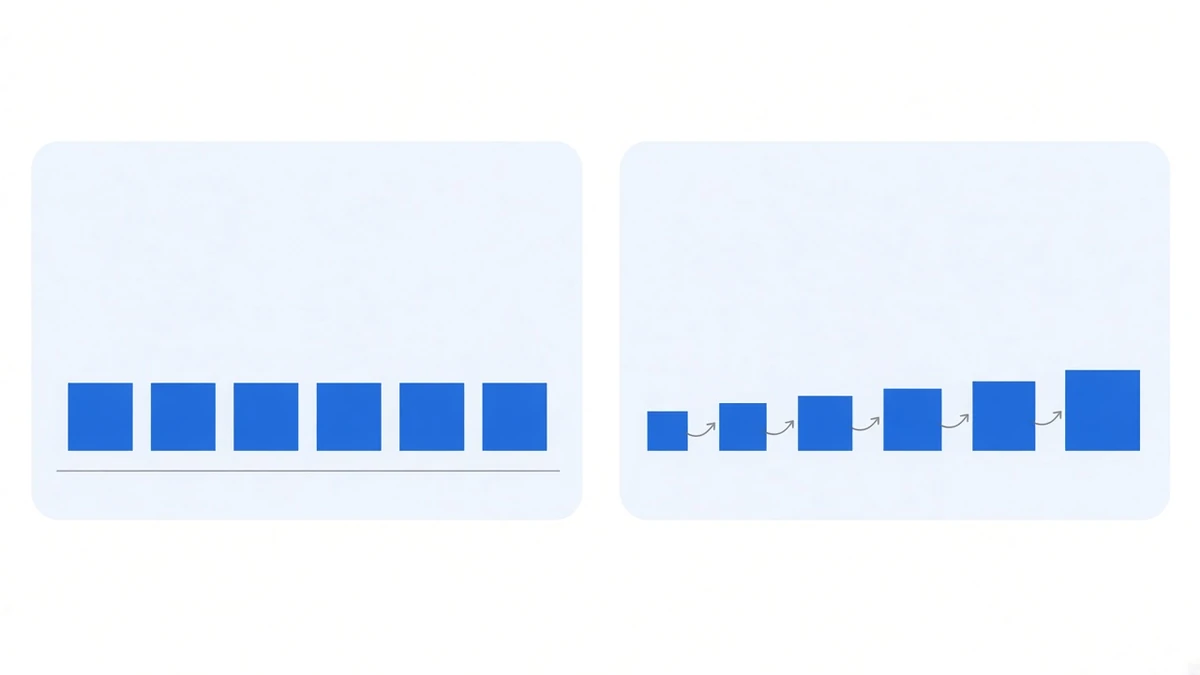
Yes, but not for free, and not every period.
What is workable is a longer cycle: let funding accumulate for a while, and once it reaches a meaningful size, scale both legs up in one synchronised move. That drops the reinvestment frequency from every eight hours to monthly or quarterly — and per the table above, the part you lose by slowing down was small to begin with.
The real obstacle is on the other side. Every top-up pays fees and slippage on both venues, and both legs have to move together with matching size or you have just created a directional exposure at the moment of the top-up. The more often you add, the more friction you eat. Net of that, what you actually collect is no longer the theoretical curve.
There is also a blunt practical precondition: compounding assumes you took nothing out for seven years. Getting money back out notes that in practice most people withdraw at some point. Once you have, the compounded curve no longer describes your account.
One footnote on conventions
The 2020 row in that table deserves a second look.
The per-settlement data gives 17.2397%, while the year-by-year performance table shows 18.764618%. The 1.5-point difference is not a convention issue — the 2020 cell in the performance table is a cumulative figure from the legacy dashboard, with an unknown settlement count and no way to reconcile it period by period. That is flagged in the data file and flagged on the page.
Every year from 2021 onward reconciles. Looking at those six alone: summed 61.8624%, compounded 85.6090%, a gap of 23.7 points. Same conclusion.
Data and conventions
From the per-settlement records in our FundingRateTicks table, BTCUSDT and ETHUSDT 7,372 settlements each, 2020-01-01 to 2026-09-23 (UTC). Summed = the plain sum of per-period rates; compounded = the product of (1 + rate) over all periods, minus one. Neither deducts fees, slippage or funding costs, and neither is a net return.
Year-by-year performance is whatever /performance/ says, and it is always the summed convention. Cumulative figures from a historical window imply nothing about any future one.