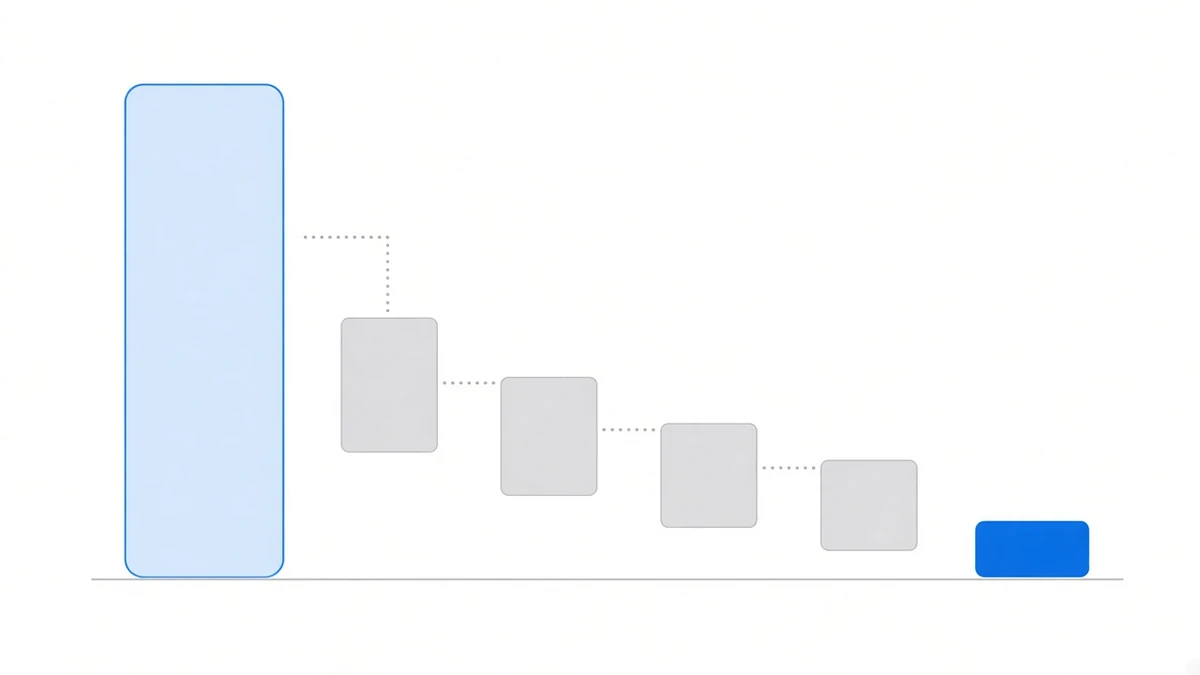
Anyone searching for a funding rate arbitrage calculator has usually already typed a principal and a rate into one and got an annualised figure back. That figure is the gross return, not the money that reaches you.
Five steps sit in between, and you can do every one of them yourself:
gross return = principal × annualised rate on scaled capital
take-home    = floor + (gross return − management fee − floor) × your share
Calculators normally stop at the first line. Here is the second one, unpacked.
Step 1: the rate is charged on notional, not on margin
Funding is settled on notional: notional = mark price × position size. This scheme scales capital by 10x, so 1,000 USDT of principal carries 10,000 USDT of notional and a 0.01% settlement is 1 USDT, not 0.1 USDT.
The general way to annualise is by the hour:
annualised = per-settlement rate × 8760 ÷ settlement interval in hoursEight-hour contracts are ×1095, four-hour ones ×2190. Annualise before comparing, or the four-hour batch gets sorted into the wrong place every time. The formula itself, and the three mistakes people make with it, are in how funding rates are calculated.
One more line that gets dropped: you only pay or receive if you hold at the settlement stamp. Close one minute before and that settlement costs and pays nothing; funding is not prorated by holding time.
Step 2: subtract four cost lines
Net return = accumulated funding − perpetual leg fees − spot leg fees − scaling-capital interest − slippage.
The capital scaling here runs on the exchange’s own rules rather than a borrow, and that capital carries no interest, so the “scaling-capital interest” cell reads 0 for the period. The line stays in the table anyway: change the funding arrangement and a number reappears in that cell.
What actually eats the return is the four taker fills at the two ends:
round-trip cost = 2 × (perp taker fee + spot taker fee) + 2 × (perp half-spread + spot half-spread)
settlements to break even = ⌈round-trip cost ÷ per-settlement rate⌉
Measured on our own accounts: INJUSDT ran 0.30% round-trip fees and 0.048% round-trip spread. CHRUSDT prices carry only five significant digits, so a single tick is 0.074% and the round-trip spread costs as much as the fees. The ugliest row was HOLOUSDT — counting fees only it nets +0.002% per settlement, and with spread included it is −0.09%.
So an annualised figure has to be read next to the break-even count. The rest of the costs that never show on the interface are in six hidden costs.
Step 3: the management fee comes out of the return, not out of principal
All three plans charge the same 2% annual management fee. Where it comes from is not a wording choice: 2% out of principal means you pay it up front, 2% out of the return means a thin year collects less. In a year where the return does not cover it, the platform collects less and does not bill the investor for the difference. The money sits in the platform’s dedicated account under separate books, and which items an investor can pull is set out in custody and verification.
Step 4: the split between the three plans
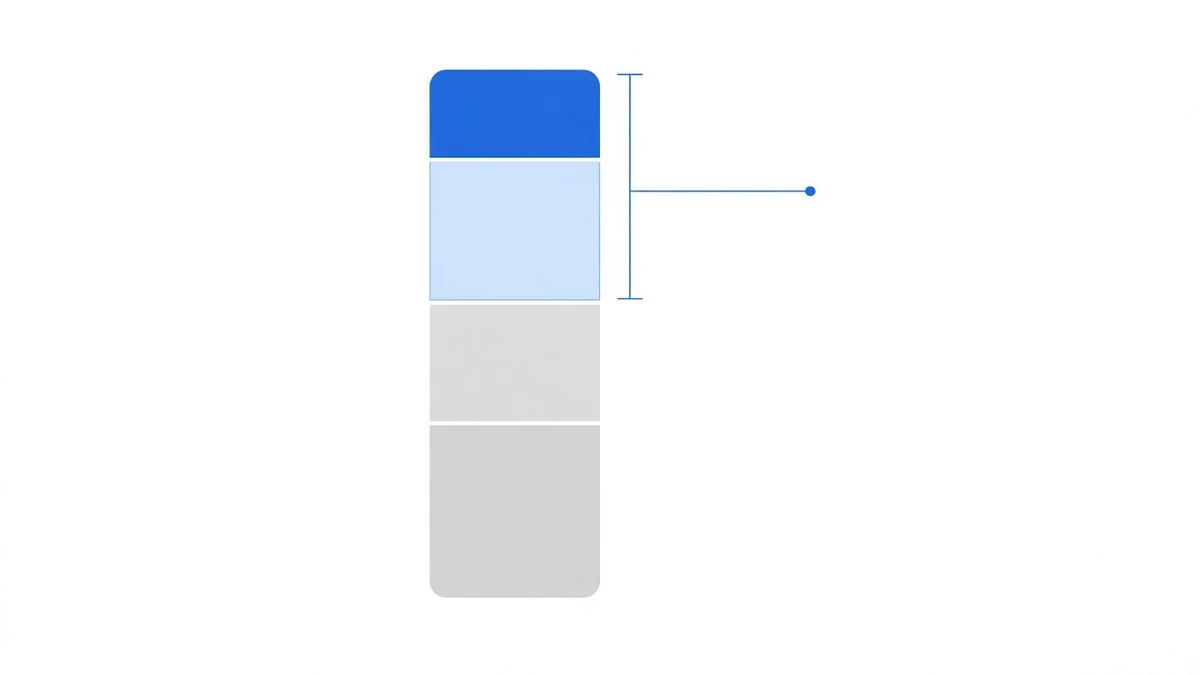
Excess = gross return − management fee − floor, and what is left is divided by plan (the full terms are on plans and pricing):
| Plan | Floor APR | Excess split (platform : you) |
|---|---|---|
| Capital and yield protected | 7% (take-home) | 100 : 0 |
| Capital protected, 7:3 | none | 70 : 30 |
| No capital guarantee, 3:7 | none | 30 : 70 |
Put 10,000 USDT of principal through it twice. Once with the worst cell on our year-by-year table (ETHUSDT in 2022, 7.873% on scaled capital), once with the average of the ten cells across 2021–2025 (124.296% on scaled capital):
| Plan | Take-home at 7.873% | Take-home at 124.296% |
|---|---|---|
| Capital and yield protected | 700.00 USDT (7.000%) | 700.00 USDT (7.000%) |
| Capital protected, 7:3 | 176.19 USDT (1.762%) | 3,668.88 USDT (36.689%) |
| No capital guarantee, 3:7 | 411.11 USDT (4.111%) | 8,560.72 USDT (85.607%) |
Read the three rows together and you can see what each plan is trading:
- Plan one is identical in both columns. 7% is the floor and also the ceiling — in the thin year the gross does not even cover the fee plus the floor (787.30 − 200 − 700 = −112.70) and the platform makes up the difference; in the good year the whole 11,529.60 USDT of excess goes to the platform. That is what the floor was bought with.
- Plans two and three are twenty times apart across the columns. They have no floor, so whatever the strategy does that year is what reaches you — why it might do that, and who eats the loss, is in the risks in funding rate arbitrage.
The right-hand column is an extrapolation, not a promise. It assumes every future year repeats the 2021–2025 average, while the same table shows ETHUSDT at 7.873% in 2022. Year by year, worst year included, it is all on the track record.
Step 5: do not let it compound
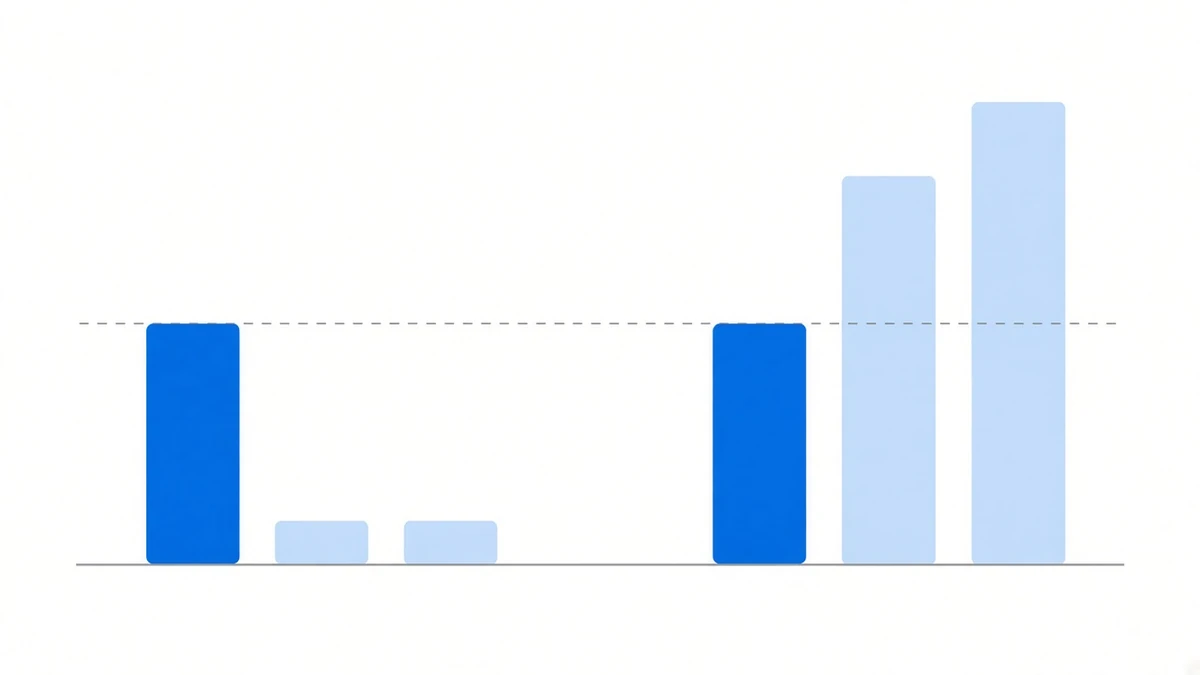
The three plans settle annually, quarterly and monthly — returns are paid out, not rolled into principal. Principal stays flat, so each year’s arithmetic is identical and five years is simply one year × 5, strictly linear.
When you see a compounding curve bending upward, ask what it assumed. At minimum it assumed you reinvested every distribution, and the terms say no such thing.
Check it yourself
- Is that annualised figure the raw rate or the scaled-capital one? They are 10x apart
- Is the settlement interval 8 hours? If not, the annualisation factor changes
- Did anyone count settlements to break even, and does round-trip cost include spread?
- Does the management fee come out of principal or out of the return?
- Is the figure take-home after floor plus split, or just the gross?
The last one is the widest gap: from the same 787.30 USDT of gross return, the three plans take home 700.00, 176.19 and 411.11 USDT. Turning these five checks into a yardstick for a specific platform is four questions to settle first.