Pin the definition down first, because this is where most of the confusion starts.
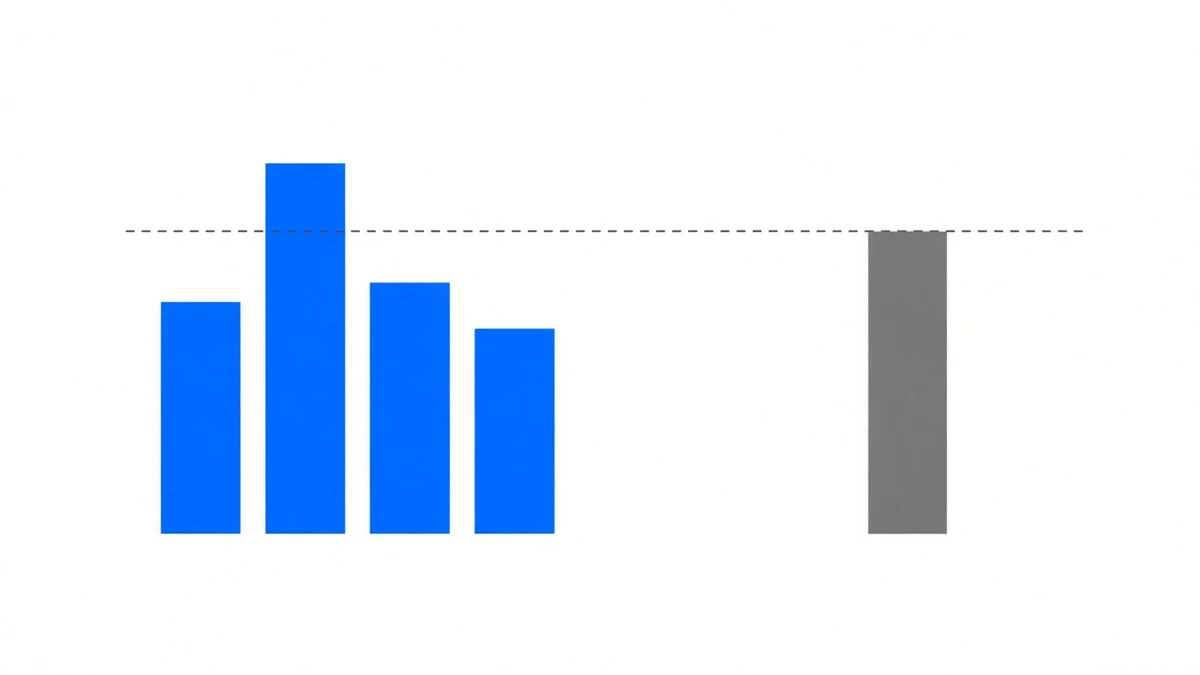
Position-weighted average funding rate = (each leg’s notional × its own rate), summed, divided by total notional.
Not the rates of a few coins added up and divided by how many there are. Those two agree only when every leg is the same size.
Why it matters: say 95% of your capital sits in BTC and the remaining 5% in an altcoin paying 0.3% a period. A simple average will tell you the “portfolio rate” is high; in the weighted version that altcoin contributes 0.015 percentage points. A leg with a great rate that cannot absorb capital barely affects the portfolio.
With that settled, the question worth asking is the next one: how much steadier does this number actually get when you add legs?
Four coins, equal weight, 793 periods measured
Taking BTCUSDT, ETHUSDT, SOLUSDT and BNBUSDT and lining up their rates for the same settlement instant (all four are on eight hours; 793 periods line up), then building an equal-weight basket:
| Per-period std dev | Share of periods negative | |
|---|---|---|
| BNBUSDT alone | 0.00434% | 0.88% |
| BTCUSDT alone | 0.00482% | 26.36% |
| ETHUSDT alone | 0.00568% | 31.15% |
| SOLUSDT alone | 0.00983% | 49.18% |
| Equal-weight basket | 0.00470% | 33.54% |
Neither result flatters diversification.
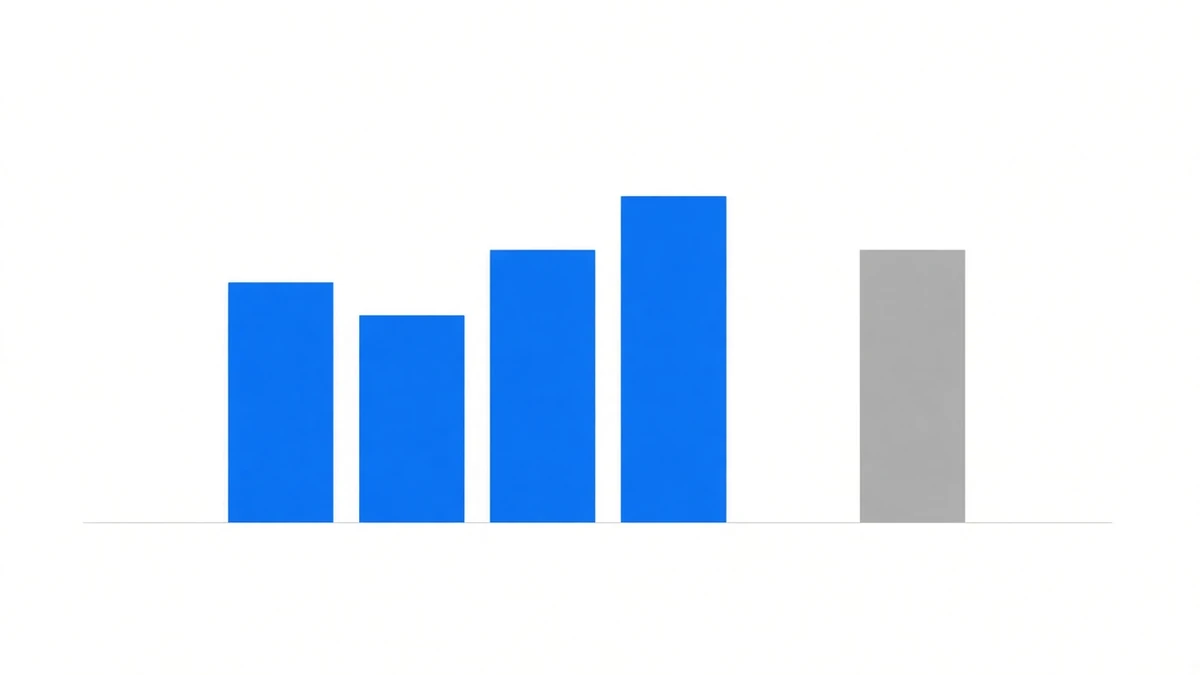
Volatility barely moved. The basket’s per-period standard deviation is 0.00470% against 0.00482% for BTC alone — a reduction of 2.5%. And BNB on its own (0.00434%) is steadier than the basket.
Negative periods became more frequent. Holding BTC alone, 26.36% of periods came in negative. Diversified, 33.54%. Seven points worse.
That runs against the intuition that spreading reduces risk. Two reasons.
Reason one: the correlations are not low enough
How much volatility diversification removes depends on how out of step the legs are. Pairwise correlations over the same 793 periods:
| BTC | ETH | SOL | |
|---|---|---|---|
| ETH | 0.5509 | ||
| SOL | 0.3658 | 0.4925 | |
| BNB | 0.3056 | 0.3646 | 0.3735 |
Everything lands between 0.31 and 0.55. Not one pair is anywhere near zero, and none is negative.
That is reasonable: funding reflects the perpetual’s premium over spot, and market-wide positioning moves together. Days on which all four trade at a discount are common, and they do not cancel each other out.
Reason two: one laggard lifts the whole basket
SOL’s per-period standard deviation this year is 0.00983%, 2.3 times BNB’s 0.00434%; 49.18% of its periods are negative and its cumulative for the year is still below zero.
Equal weight means it is a quarter of the book. Put a component with twice the volatility at a quarter weight alongside three steady ones and the result is not “everything becomes steady” — it is the three steady ones being dragged down.
As for why negative periods became more common: the basket books a negative period whenever the weighted sum is below zero. In the periods where SOL is deeply negative, it alone can swallow the small positives from the other three. Diversification raised the probability that at least one leg is dragging, not lowered it.
Which symbols belong in the book, and what the four majors look like period by period, is in which coins suit funding rate arbitrage; how large each leg should be is in sizing a delta-neutral position.
So is diversification useless
No — but what it protects against is not “a thin period”.
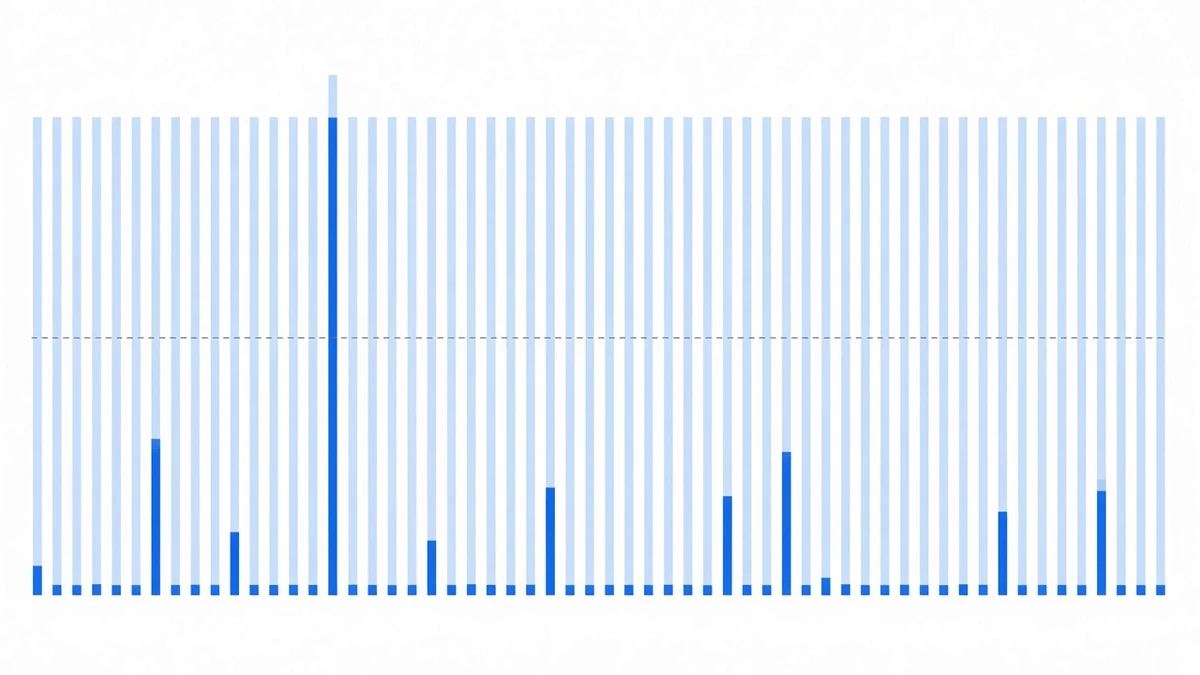
Widen the view to the whole market. Across the periods in 2026 where 100+ contracts settled simultaneously (1,584 of them), the share of contracts coming in negative was:
- Mean: 23.73%
- Worst single period: 61.16%
- Best single period: 3.75%
- Periods where more than half of contracts were negative: just 1.39%
That last line is the important one. The whole market going negative at once is extremely rare. When a negative period bites you, it is nearly always because you happened to be holding one of the quarter that went negative, not because the market as a whole turned.
So what diversification genuinely protects against is single-contract tail events: being switched to hourly funding and then paying out for a week straight (95 contracts this year — see Binance funding settlement times), a single period truncated at the −2% floor (145 times across 82 contracts this year — see the funding leaderboard), or the contract simply being delisted.
Landing on a single contract, these are catastrophic — and they are uncorrelated with each other. Diversification does far more against that class of risk than it does against day-to-day variance.
What to ask when you see this number
When a platform or dashboard reports “portfolio weighted average funding X%”, three questions:
- What is the weight? Notional or margin? They differ a great deal, and the latter inflates small highly-leveraged legs.
- Does the denominator include uninvested capital? Cash that is not in a position earns no funding, and leaving it out of the denominator flatters the figure considerably.
- Which period is it? Single-period values jump around; quoting one period is the same as quoting nothing. Look at a window’s cumulative figure together with how many of its periods were negative.
The six things you can verify and the one you cannot are in how to verify the returns a platform reports; our own year-by-year record is in performance, worst years on the same table; how the two legs are run is in how it works.
In one line
A weighted average funding rate is weighted by money, not averaged across coins; and adding legs reduces the risk of a single contract blowing up rather than the risk of a thin period — which, in the four-coin equal-weight test, actually rose from 26.36% to 33.54%.
Data: per-settlement funding rates from our own collection database (sourced from Binance’s public USD-M endpoints). The four-coin basket uses the 793 periods between 2026-01-01 and 2026-09-22 03:00 UTC where BTCUSDT, ETHUSDT, SOLUSDT and BNBUSDT all have a settlement at the same instant; equal weight means 25% of notional per leg. Standard deviation is the sample standard deviation of per-period rates; correlations are Pearson over the same 793 periods. The market-wide distribution uses the 1,584 periods in the same window with 100+ contracts settling simultaneously. Cumulative figures are sums of per-period rates. The equal-weight basket here is a demonstration of the convention, not our actual book and not an allocation recommendation; actual year-by-year results are in performance, site snapshot 2026-08-25 13:42 UTC. Past performance does not indicate future results.