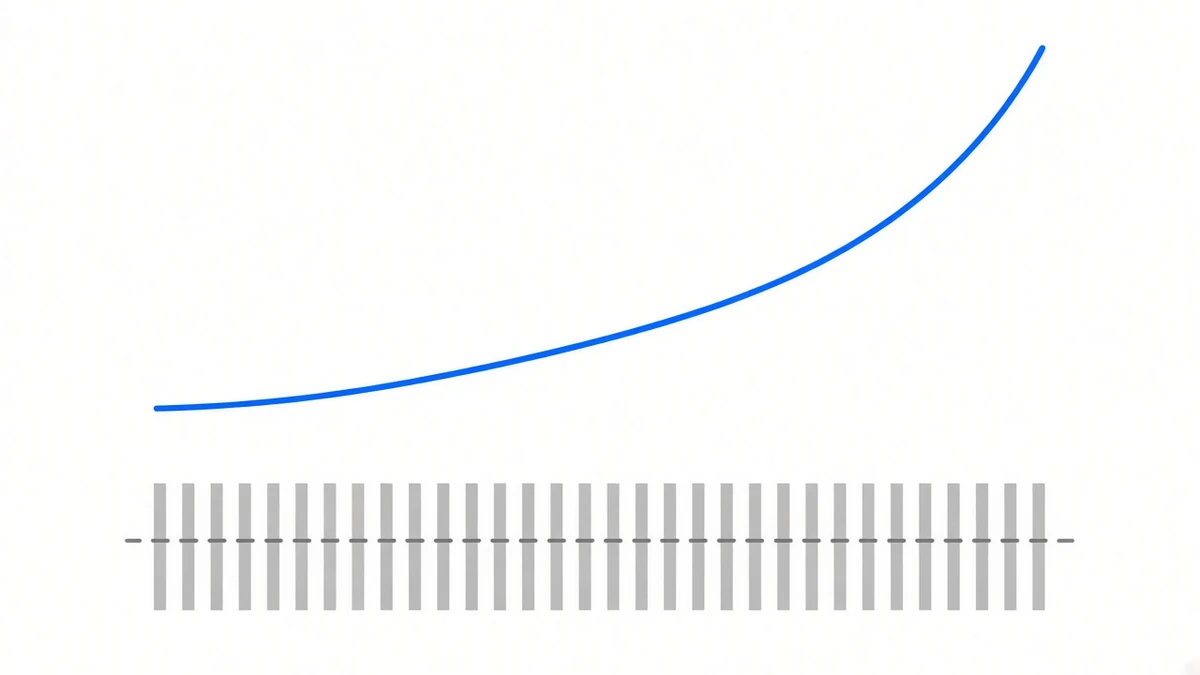
On 21 September BTC cleared $86,000 for the first time since January. What pushed it there was not new buying — it was shorts being closed out.
Per CoinGlass’s 24-hour figures: $746.6m liquidated market-wide, of which $647.9m was shorts, about 87%; BTC alone accounted for roughly $277.5m of short liquidations. Over the same window open interest rose 7.6% toward $156bn and volume rose about 39% to $224bn. Price up with open interest up means fresh positions did come in after the squeeze, rather than the move being entirely forced buying.
That is the external half. The half we can add is what funding actually did that day.
On squeeze day, the week’s lowest period was the breakout itself
Every Binance BTCUSDT settlement from 18 to 22 September (it is on eight hours, three a day):
| Date (UTC) | 00:00 | 08:00 | 16:00 |
|---|---|---|---|
| 09-18 | 0.007769% | 0.007903% | 0.006853% |
| 09-19 | 0.006643% | 0.010000% | 0.010000% |
| 09-20 | 0.010000% | 0.010000% | 0.007524% |
| 09-21 | 0.004200% | 0.010000% | 0.005485% |
| 09-22 | 0.007663% |
Look at the 09-21 row. The lowest period of the entire week — 0.004200% — falls at the start of the day the breakout happened. The day and a half before it (09-19 afternoon through 09-20 morning) had four consecutive periods pinned at 0.010000%.
That 0.01% reading carries no information either. Binance’s USD-M default interest rate is 0.01% per 8 hours, and the clamp formula flattens every period whose premium sits inside the dead zone to exactly 0.01% — worked out in the entry-timing piece. The readings that do carry information are the ones below 0.01%, and the 09-21 period came in under half the ceiling.
A squeeze that drove price to a six-month high left no trace of crowded longs on the largest perpetual there is.
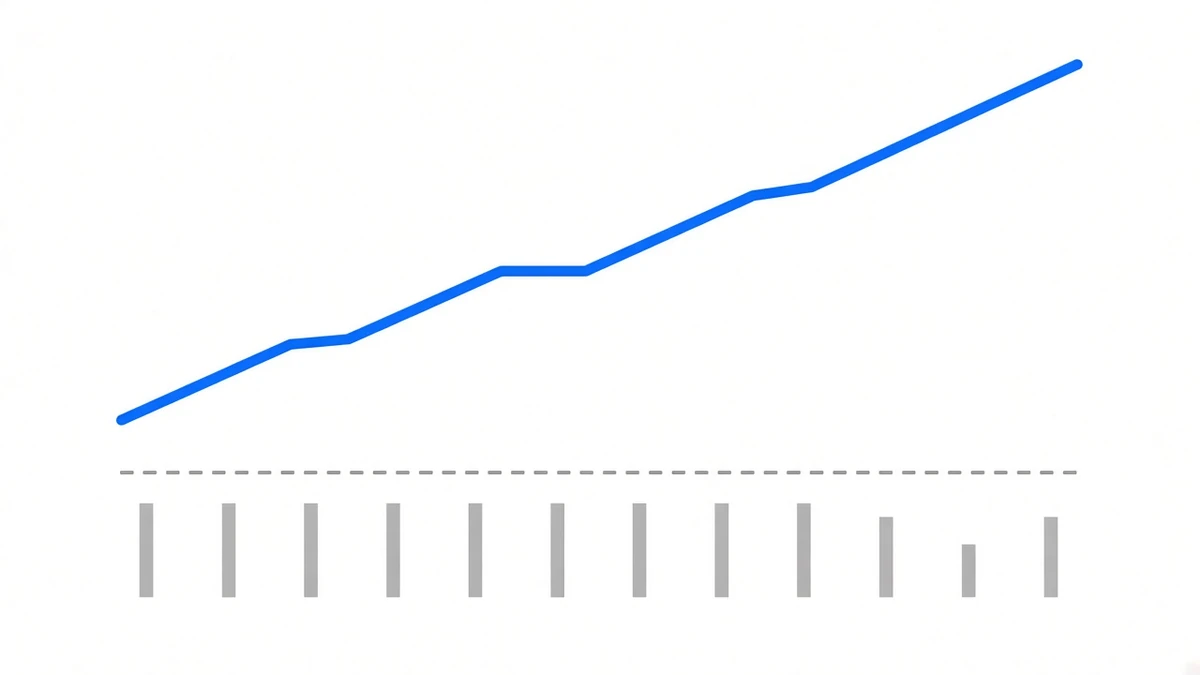
Market-wide: negative periods thinning, median frozen
Across the 447 symbols with data, aggregated by calendar day:
| Date (UTC) | Periods | Share negative | Mean per period |
|---|---|---|---|
| 09-17 | 2,358 | 15.27% | −0.005757% |
| 09-18 | 2,379 | 9.71% | −0.003721% |
| 09-19 | 2,368 | 9.71% | +0.000621% |
| 09-20 | 2,352 | 8.89% | −0.003868% |
| 09-21 | 2,361 | 8.60% | +0.000934% |
| 09-22 (partial) | 778 | 6.81% | +0.003041% |
The share of negative periods fell from 15.27% to 6.81%, close to half. That is consistent with shorts being cleared out.
But another number did not move: the market-wide median on 09-20, 09-21 and 09-22 was 0.005000% on all three days, to the digit.
Put the two together and the picture completes: the shorts left, but the longs did not arrive. The tail contracted (the deeply negative slice thinned) while the large middle stayed exactly where it was. Genuine long crowding would have lifted the median with it.
What it means for a balanced two-leg book
A balanced book does not care where price went. It cares whether funding turned negative. The answer for this week: not one period went negative on the four majors — every BTC, ETH, SOL and BNB reading from 09-18 to 09-22 was positive.
That is not a result to celebrate. Since the squeeze did not lift funding, for a collector this week was indistinguishable from an ordinary one — two of BTC’s three daily periods still came in below the ceiling. Returns accrue by period count even while the tape is dramatic, and that is simply the shape of this strategy.
What to watch next
Not price — whether the median can leave 0.005000%. Once it lifts, longs are genuinely paying; while it stays pinned, further price gains are just price. The other thing worth watching is whether the negative share rebounds above 15%, which would say the tail is thickening again.
And the usual line, stated plainly: funding drifting toward zero or turning negative is something this strategy genuinely runs into. The 0.787256% ETH returned across all of 2022 on the performance table came from exactly that, and we have not hidden it. It did not happen this week. That does not mean it will not happen next week.
Sources: liquidation totals, the long/short split, open interest and volume come from CoinGlass as reported by HTX Insights (https://www.htx.com/news/after-bitcoin-breaks-86000-level-648-million-in-shorts-liqui-bHmSZYYS/), on a 24-hour basis for 2026-09-21; the price breakout and ETF flow figures come from the same source. Per-settlement funding rates come from our own collection database (sourced from Binance’s public USD-M endpoints), window 2026-09-17 00:00 to 2026-09-22 03:00 UTC, with the market-wide aggregate covering the 447 symbols carrying data in that window; the 09-22 row is an incomplete day. The median is the median of all settlements that day. The 0.01% per 8 hours interest rate is the Binance USD-M default. Yearly cumulative figures are in performance, site snapshot 2026-08-25 13:42 UTC. This post records readings that have already happened and makes no forecast. Past performance does not indicate future results.