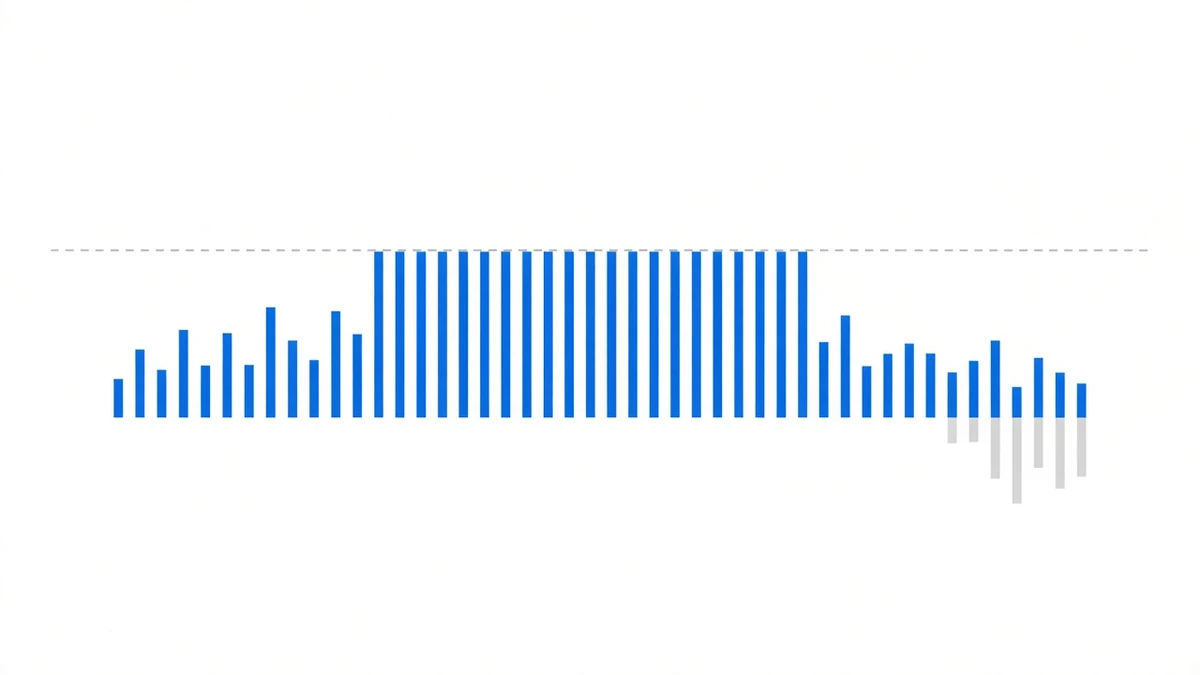
“Funding is too low right now — I’ll wait for it to climb before opening.” That is the question we get more than any other.
The answer, for this year: there was no climb. Pull every settlement Binance published on its USD-M contracts between 1 January and 21 September 2026 00:00 UTC — 790 periods per instrument — and BTCUSDT, ETHUSDT and SOLUSDT never once printed above 0.01%. The maximum for all three is exactly 0.010000%.
Periods strictly above 0.01%: zero, zero and zero.
What the ceiling looks like across 790 periods
| Instrument | Periods | Cumulative | Annualised | Max | Min | Negative periods |
|---|---|---|---|---|---|---|
| BTCUSDT | 790 | 2.103149% | 2.92% | 0.010000% (08-19 16:00) | −0.015178% (02-07 00:00) | 209 |
| ETHUSDT | 790 | 1.277538% | 1.77% | 0.010000% (08-20 16:00) | −0.036526% (02-23 08:00) | 247 |
| SOLUSDT | 790 | −0.941791% | −1.31% | 0.010000% (07-10 16:00) | −0.069212% (02-01 00:00) | 390 |
| BNBUSDT | 790 | 2.078423% | 2.88% | 0.032423% (08-22 08:00) | −0.012728% (03-20 08:00) | 7 |
Start with the worst row. SOL was negative in 390 of its 790 periods and finished the year to date at −0.941791%. Roughly half the settlements paid out rather than in, and the running total is below zero. Anyone waiting for SOL funding to “climb” has now been waiting nine months.
The medians say more than the extremes. BTC’s per-period median is 0.003297%, a third of 0.01%; SOL’s is 0.000213%, which is zero in practice. Yet the 95th percentile for all three is exactly 0.010000% — the top quarter of the distribution is flattened into a single line.
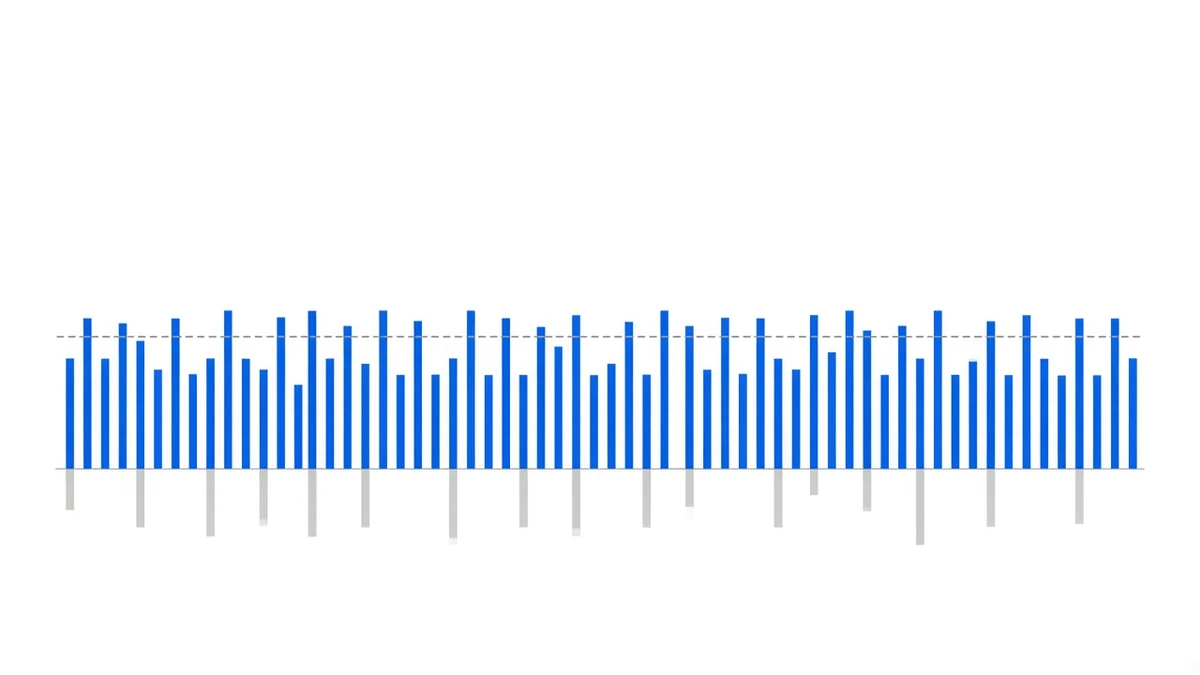
The ceiling is the formula, not the market
Binance publishes the arithmetic:
funding rate = premium index + clamp(interest rate − premium index, −0.05%, +0.05%)The default interest rate on USD-M contracts is 0.01% per eight hours. Expand that expression in three ranges of the premium index:
| Premium index | Clamp term | Resulting rate |
|---|---|---|
| Below −0.04% | Pinned at +0.05% | premium + 0.05% (below 0.01%) |
| Between −0.04% and +0.06% | Cancels exactly | Identically 0.01% |
| Above +0.06% | Pinned at −0.05% | premium − 0.05% (above 0.01%) |
That middle band is the dead zone. Anywhere the premium index sits inside those ten basis points, the printed rate does not move at all: it reads 0.01%.
So “funding above 0.01%” carries a hard precondition: the period’s average premium index has to exceed +0.06%, meaning the perpetual must hold a premium of more than six basis points over spot for the whole period. BTC, ETH and SOL did not manage it once this year, across 790 periods each.
This is also why a 0.01% print carries no information. It only tells you the premium is somewhere in the dead zone; it says nothing about how eager the longs are. The readings that do carry information are the ones below 0.01%, because those require the premium to break under −0.04% — a perpetual trading at a visible discount. BTC had 209 of those this year, and they are the ones actually saying something.
What about “wait for funding to turn positive”?
This is the softer version, and it sounds far more reasonable: don’t chase highs, just sit out the negative stretches.
We ran it over the same 790 periods. The rule is simple: hold if the previous period’s rate was positive, otherwise stay flat. Each round trip is charged at 0.30% all-in — not a guess, but four taker fills at 2 × (0.05% + 0.1%), itemised in the six hidden costs.
| Instrument | Buy and hold | Timed, gross | Round trips | Round-trip cost | Timed, net |
|---|---|---|---|---|---|
| BTCUSDT | 2.1031% | 2.4856% | 72 | 21.60% | −19.11% |
| ETHUSDT | 1.2775% | 1.9126% | 88 | 26.40% | −24.49% |
| SOLUSDT | −0.9418% | 1.2143% | 113 | 33.90% | −32.69% |
| BNBUSDT | 2.0784% | 1.6990% | 93 | 27.90% | −26.20% |
Read the BTC row carefully, because it shows what kind of problem this is: the timing works. Gross return rises from 2.1031% to 2.4856%, an extra 0.38 points. SOL is more dramatic still — a full year of −0.9418% becomes +1.2143%, better than two points, a losing year turned positive.
The signal is real. The price of acting on it is the problem.
Those 0.38 points on BTC cost 72 round trips to collect, at 21.60% — fifty-six times what they earned.
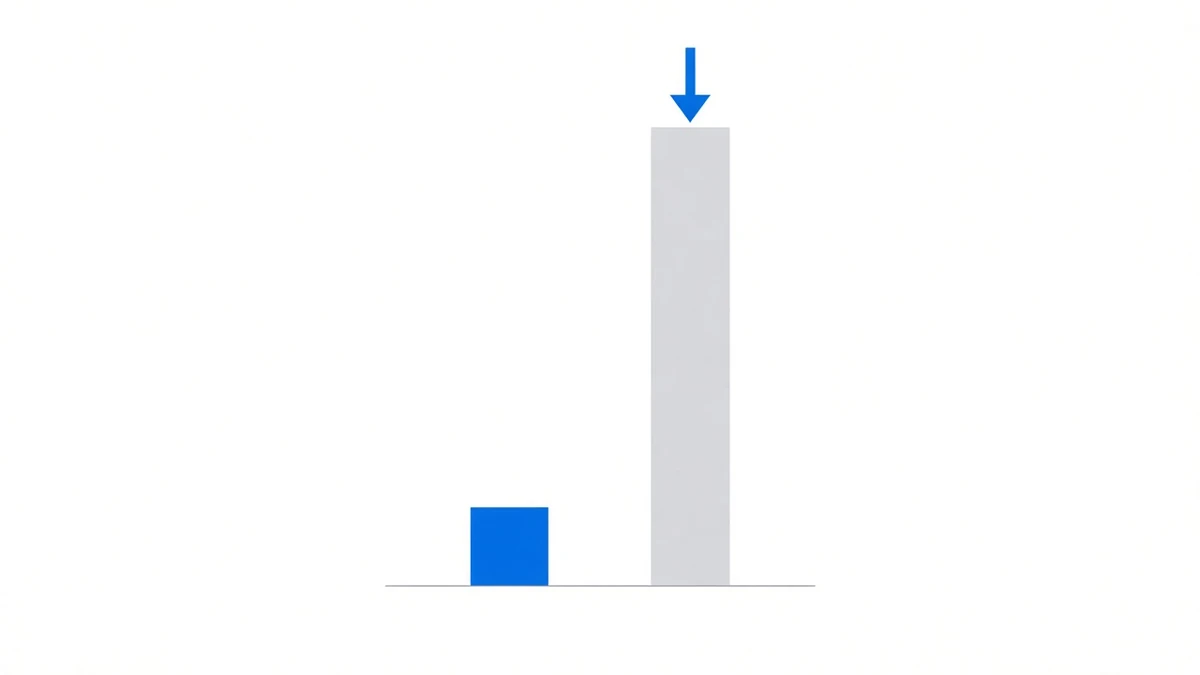
How many periods does one round trip take to repay
Spread 0.30% across the funding rate and it becomes obvious:
- At the capped 0.01%, one round trip needs 30 periods — ten days — to break even.
- At BTC’s median this year, 0.003297%, it needs 91 periods, about thirty days.
- At SOL’s median, 0.000213%, it needs 1,409 periods — more than the year has produced so far.
And funding flips sign far faster than that. BTC ran 209 negative periods against 581 positive ones, and the alternation chops those 790 periods into small pieces. Every negative stretch you dodge costs you a thirty-day ticket.
BNB is the only exception, and it does not hold up either
BNBUSDT is the one instrument in the table that genuinely printed above 0.01%: 63 of 790 periods, topping out at 0.032423%.
The reason is a parameter, not a market. BNBUSDT’s interest rate is 0, not 0.01%. With a zero baseline the dead zone relocates to zero — the instrument printed exactly 0.000000% in 423 periods this year, and exactly 0.01% in none. Binance runs a batch of contracts on this setting, which we counted in why funding is positive most of the time.
Since it is the only instrument with a genuine “high rate” worth waiting for, raise the bar on it and try again:
| BNBUSDT timing rule | Gross | Round trips | Cost | Net |
|---|---|---|---|---|
| Previous period > 0 | 1.6990% | 93 | 27.90% | −26.20% |
| Previous period > 0.01% | 0.5048% | 42 | 12.60% | −12.10% |
| Previous period > 0.02% | 0.0967% | 3 | 0.90% | −0.80% |
At a 0.02% threshold the round trips collapse from 93 to 3 and the cost to 0.90% — about as restrained as this can be played. The net is still negative, against +2.0784% for simply holding.
The more selectively you pick, the fewer periods you can hold; return accrues per period while cost is paid per trip. The two work against each other in the same direction, and no threshold satisfies both.
So the thing to watch is not the entry point
If this has to compress to one line: what settles the account is the ratio of periods held to all-in round-trip cost, not the reading at the moment you open.
Three quantities can change the outcome, ordered by how much control you have:
- All-in cost. The numerator. Taker to maker, instruments with tight spreads, avoiding small coins quoted to five significant figures — this comes down for real, and it stays down.
- Periods held. The denominator. The same rate series pays 2.10% held for all 790 periods and −19.11% cut into 72 segments.
- Instrument choice. BNB was negative in 7 periods this year; SOL in 390. That gap is larger than anything timing produces, and collecting it does not require trading in and out.
Whether the reading is 0.003% or 0.01% when you open matters less to the annual result than one unnecessary round trip.
Two things worth stating plainly
First, this backtest is done with the answers in hand. The rule uses “the previous period’s rate,” which is what live trading sees too, so there is no lookahead there; but every round trip is charged a flat 0.30%, with no allowance for widening slippage in fast markets, borrow-rate spikes, or the last few periods before a contract is delisted. Real timing costs can only exceed 21.60%, never undercut it.
Second, negative funding is a normal outcome of this approach, not a malfunction. SOL is at −0.941791% year to date; ETH returned just 0.787256% across all of 2022. Both numbers sit in the year-by-year table on our track record page, and we did not omit them. BTC’s 2.92% annualised this year is worse than any good year on that table, and it is what 790 real settlements produced.
For how the rate itself is computed and where the clamp comes from, see how funding is calculated; for working the other side and whether to borrow, see when funding goes negative; for all six years side by side, the best year and the worst are on the same table in the six-year review.
Sources: per-period funding from Binance’s public USD-M endpoint fapi/v1/fundingRate, range 2026-01-01 00:00 to 2026-09-21 00:00 UTC, 790 periods per instrument, read at 2026-09-21 07:33 UTC; interest rate and clamp convention from Binance’s public documentation and the interestRate field of fapi/v1/premiumIndex (0.00010000 for BTCUSDT, 0.00000000 for BNBUSDT); the 0.30% all-in cost is itemised in the six hidden costs; yearly totals on the track record page, on-site snapshot timestamp 2026-08-25 13:42 UTC. Past performance does not indicate future results.