How far back does Binance USD-M funding go? The earliest settlement in our database is 1 January 2020, 00:00 UTC, and through 22 September 2026, 03:00 UTC there are 897,919 periods across 450 symbols.
Getting the data is not the hard part. Doing the arithmetic afterwards is — the same per-settlement series will produce different annual figures depending on conventions you may not realise you picked, and neither version raises an error.
First, what is actually in there
“898k periods since 2020” invites a misreading, so here is the width year by year:
| Year | Periods | Symbols covered | Share negative |
|---|---|---|---|
| 2020 | 2,196 | 2 | 8.47% |
| 2021 | 2,190 | 2 | 5.71% |
| 2022 | 2,190 | 2 | 28.13% |
| 2023 | 2,190 | 2 | 9.63% |
| 2024 | 2,196 | 2 | 6.28% |
| 2025 | 282,991 | 418 | 31.84% |
| 2026 | 603,966 | 450 | 25.03% |
The first five years hold two symbols each: BTCUSDT and ETHUSDT. The width only opened up in August 2025 — before that we tracked majors only.
This belongs up front because it bounds which claims survive. Saying “25.03% of periods market-wide came in negative” is fine for 2026, with 600k periods and 450 symbols behind it. Saying the same thing about 2022 is not: that 28.13% describes two coins.
Convention one: which timezone draws the year boundary
This is the sneakiest of the three.
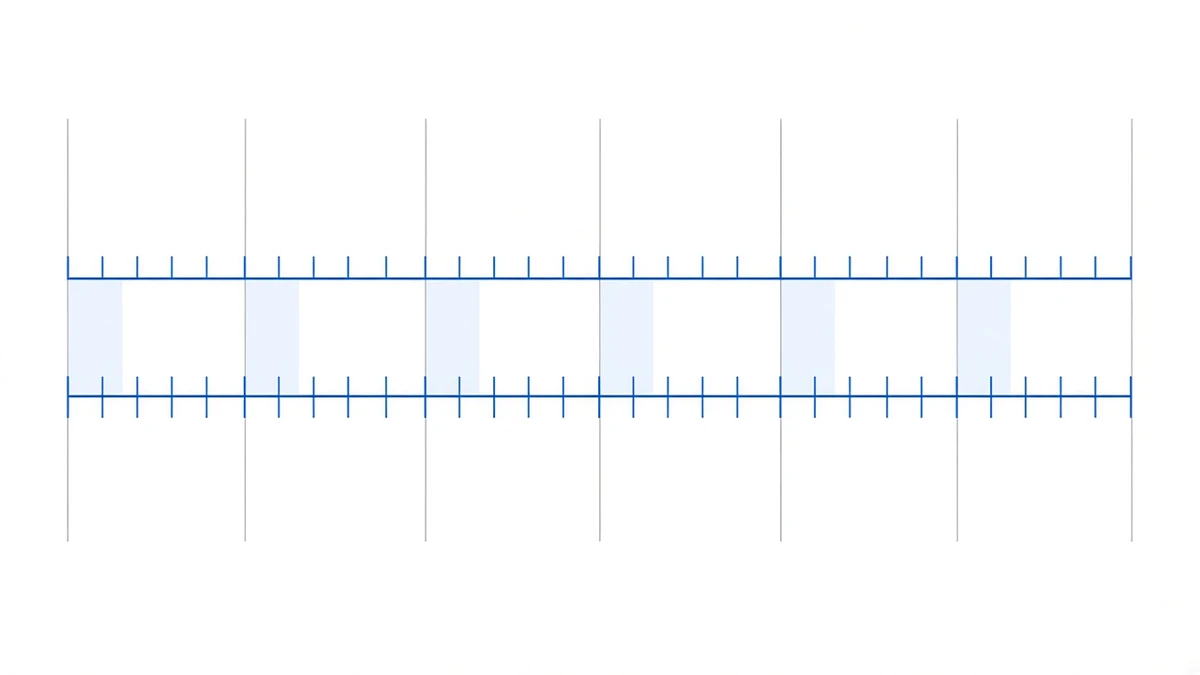
Settlement timestamps are in UTC. When you bucket them into years, does the boundary fall at midnight UTC on 1 January, or midnight Beijing time? The two choices put the periods around New Year into different buckets.
Same BTCUSDT rows, both ways:
| Year | Bucketed by UTC | Bucketed by Beijing time |
|---|---|---|
| 2021 | 30.608423% | 30.635167% |
| 2022 | 4.164925% | 4.164925% |
| 2023 | 7.865712% | 7.842115% |
| 2024 | 11.956883% | 11.980480% |
| 2025 | 5.126428% | 5.132678% |
2022 happens to match exactly (the periods either side of the boundary cancel out); every other year differs slightly. 2023 differs by 0.0236 percentage points.
That sounds trivial, and the size is not the problem. The problem is that your number will not reconcile with a published one and neither of you is wrong. Our performance table uses the Beijing-time convention — the right column above is that table. If you pull your own copy of the data and bucket by UTC, a mismatch is expected.
Convention two: summing or compounding
There are two ways to collapse a year of per-period rates into one number:
- Summing assumes the position notional stays fixed and each period’s funding is withdrawn
- Compounding assumes each period’s funding is immediately added back to the position
Both are legitimate, and they diverge by a lot. We use summing throughout, for a specific reason: positions in this system are opened by hand and nothing is automatically reinvested, so quoting the compounded figure as a track record would be inflation. How far apart the two get on the same series is worked out in how an annualised figure gets inflated.
When you see a historical annualised number, ask which one it is. When it is not stated, it is usually the flattering one.
Convention three: years with unknown period counts cannot sit beside complete ones
We have a mismatch of our own on the 2020 cell, and it is not hidden.
The performance table shows 18.764618% for BTC in 2020 — a total carried over from the old dashboard. The 1,097 per-period rows in our database for that year add up to 17.202975%. A gap of 1.56 percentage points.
Where the difference sits cannot be reconciled period by period, because the old dashboard left no per-settlement detail. So that cell is flagged as having an unknown period count and is excluded from every average. 2026 is excluded for the same reason from the other direction: it is not finished, and averaging a partial year against full ones does not give you an annual mean.
The test is hard-coded: 365 days × 3 periods a day = 1,095, and any year below 1,000 periods stays out of the average.

The six years themselves
Once the conventions line up, the year-by-year values live on the performance table, best and worst on the same sheet. Two endpoints are worth repeating here:
- Best: ETH in 2021, 37.562125% (1,095 periods)
- Worst: ETH in 2022, 0.787256% (1,095 periods) — same symbol, one year apart, a factor of 47
And BTC is at 2.13% so far in 2026. Those three numbers together say more than any “historical average annualised” ever could: the year-to-year dispersion is itself the story. How to read the series and why the worst year is the one that matters is in six years of funding.
What are you looking the history up for
If it is to answer “what does this yield”, all three conventions have to line up before you get a number anyone else can check against.
If it is to verify what a platform is reporting to you, the figure to scrutinise is not the annualised number but whether they state the convention at all: summed or compounded, which years entered the average, what the snapshot time was. The six things you can verify and the one you cannot are in how to verify the returns a platform reports.
For when the next settlement lands and what cadence your contract is actually on, see Binance funding settlement times; for how a single period’s rate is computed, how the funding rate is calculated.
Data: per-settlement funding rates from our own collection database (sourced from Binance’s public USD-M endpoints), covering 2020-01-01 00:00 to 2026-09-22 03:00 UTC, 450 symbols and 897,919 periods. Annual period counts and symbol coverage are bucketed by UTC calendar year. The two-convention BTCUSDT comparison recomputes the same rows with year boundaries at UTC and at UTC+8; the right column matches the performance table (site snapshot 2026-08-25 13:42 UTC). Cumulative figures are sums of per-period rates; compounded values are shown for contrast only and are never used as a track record. The 18.764618% for 2020 is a legacy dashboard total with no per-period detail, flagged as unknown period count and excluded from averages. A complete year is defined as 1,000+ periods. Past performance does not indicate future results.