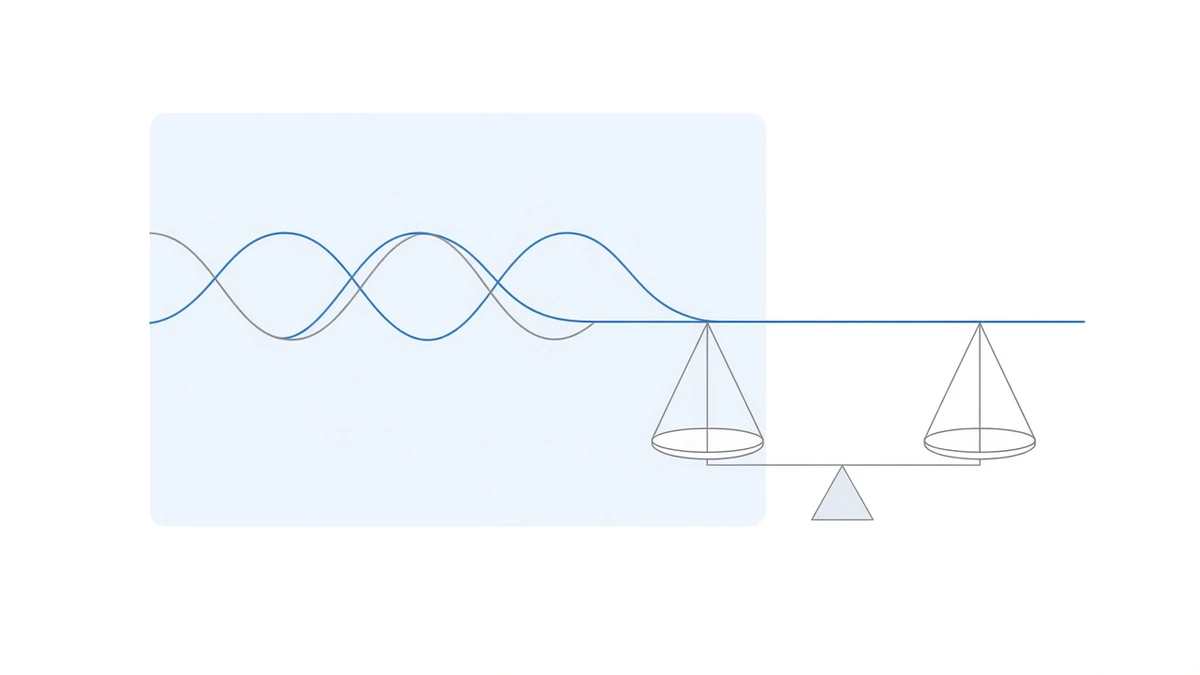
The test is equal delta, not equal dollars
The condition for a balanced pair is one sentence: the number of coins held in spot equals the perpetual short’s notional divided by the mark price.
spot quantity = perp notional ÷ mark priceSatisfy it and the two legs cancel whichever way price moves, leaving funding as the only cash flow in the book. Miss it and the position carries a directional exposure — with nothing on the exchange interface saying so. The account looks entirely normal.
Here is why splitting the money down the middle is wrong.
Where 10,000 USDT actually goes
Using the BTCUSDT mark price from our data snapshot of 25 August 2026: 79,668.15.
The intuitive split: 5,000 into spot, 5,000 into the futures account as margin.
- Spot leg:
5,000 ÷ 79,668.15 = 0.062762 BTC - Perp leg: 5,000 of margin at 5× is 25,000 of notional, or
25,000 ÷ 79,668.15 = 0.313812 BTCshort
Net delta is 0.062762 − 0.313812 = −0.251050 BTC, which at that same mark price is exactly twenty thousand dollars net short. That is not neutral. That is a bet on the downside. A 10% rally costs two thousand — a fifth of the capital — on a strategy whose entire pitch is that direction does not matter.
The correct split equalises notional on both legs. Call the notional N; at 5× the perp leg ties up N/5:
N + N/5 = 10,000 → N = 8,333.33- Spot leg: 8,333.33 USDT buys
8,333.33 ÷ 79,668.15 = 0.104602 BTC - Perp leg: short 0.104602 BTC, 8,333.33 of notional, 1,666.67 of margin
Not 5,000 / 5,000 — 8,333 / 1,667. Funding pays a percentage of notional, so the capital actually working here is 8,333, not the full ten thousand.
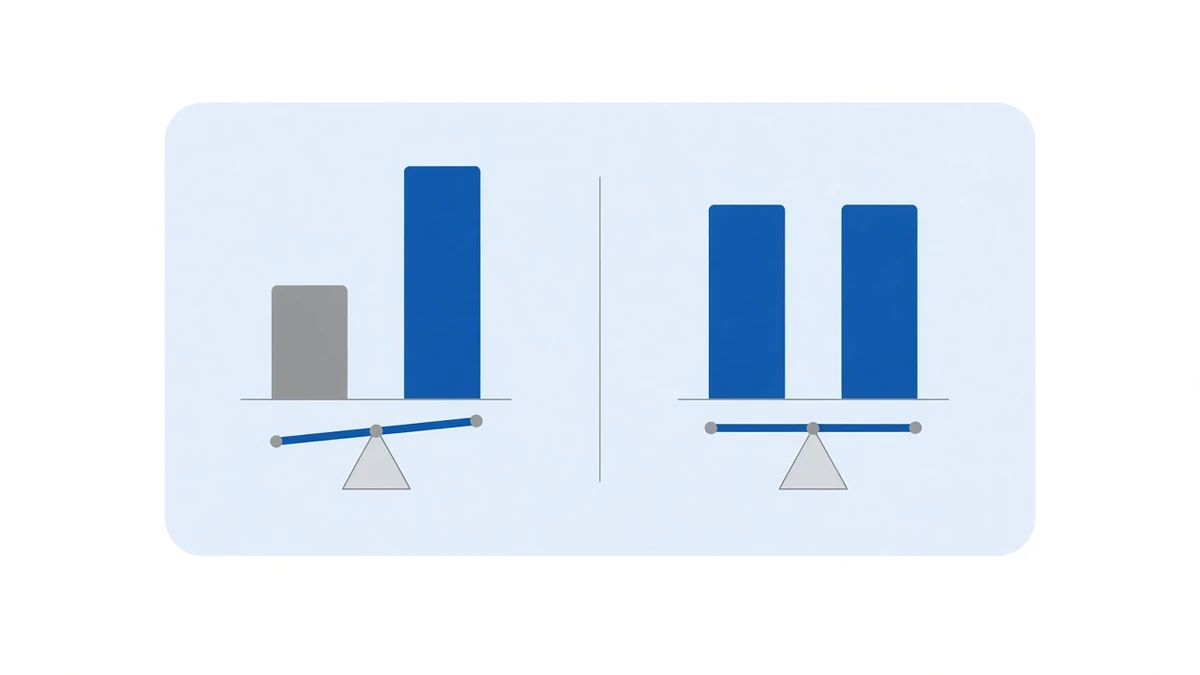
Leverage is not a yield decision, it is a distance-to-liquidation decision
The example used 5×. Changing the multiple changes how far price can run against the perp leg on the same capital:
| Perp leverage | Notional | Margin | Rough distance to liquidation | Funding at the 30-day rate of 0.554% |
|---|---|---|---|---|
| 5× | 8,333 | 1,667 | +20% | 46.2 USDT |
| 3× | 7,500 | 2,500 | +33% | 41.6 USDT |
| 2× | 6,667 | 3,333 | +50% | 36.9 USDT |
| 1× | 5,000 | 5,000 | +100% | 27.7 USDT |
Higher leverage means more notional and more funding collected, but a shorter rally is enough to reach the short leg’s liquidation price. The catch is that the profit on the spot side cannot rescue it — liquidation happens inside the futures account while the unrealised gain sits in another one, and the two do not settle against each other automatically. What a funding rate is closes on the same point; it is the most underrated line item in this strategy.
“Distance to liquidation” above is notional divided by margin, which is a theoretical ceiling. The real trigger arrives sooner because maintenance margin is not zero. Read it as an upper bound, never as headroom.
Three positions that look neutral and are not
One: splitting by dollar value. Worked through above — 5,000/5,000 at 5× leaves −0.251 BTC of exposure. Allocating money and matching delta are two different operations.
Two: sizing off last traded price. Mark price and last price usually differ by very little, but liquidation price and unrealised PnL are both computed on the mark. Size off the last print while basis is wide and the leftover exposure is the smaller problem — the miscalculated liquidation point is the real one. You believe there is 20% of room. There is not.
Three: treating beta neutral as delta neutral. The two get used interchangeably, and the difference is structural:
- Delta neutral is the same instrument, the same quantity, one long and one short. It is an identity and depends on no historical statistic.
- Beta neutral drives the portfolio’s regression coefficient against some benchmark (usually BTC) to zero, using historical correlation. Correlation shifts and the hedge stops working.
Shorting ETH perps against BTC spot is the second kind. And funding on those two instruments does not move together in the first place: across 2022, BTCUSDT accumulated 4.165% while ETHUSDT managed 0.787% — both complete years, both 1,095 settlements. Price correlation drifts; funding income is not even the same quantity.
Balance is not a one-time act
The moment price moves the two deltas stop matching. The spot leg holds a fixed number of coins while the perp leg’s notional floats with the mark. A rally inflates the short notional and the book tilts short; a selloff tilts it long.
Neutrality is therefore a maintained state, not an outcome of the opening trade. When to rebalance, how to align precision, how to roll back a leg that failed to fill — those are harder in engineering terms than the formula ever was, and they are laid out in why delta neutral is hard in practice. That the term means something entirely different on an options desk is separated out in delta neutral explained.
Getting the balance right does not make the trade profitable
One last counterintuitive point. Balancing solves price risk. It does not solve picking the wrong instrument.
Same year, same snapshot dated 25 August, first 711 settlements of 2026:
| Instrument | Cumulative funding, first 711 settlements of 2026 |
|---|---|
| BTCUSDT | +1.589788% |
| ETHUSDT | +0.960325% |
| SOLUSDT | −1.125987% |
The SOLUSDT row is negative. Balance that pair to the last decimal and the position is still paying out year to date — not losing on direction, simply sitting on the side that owes. What a negative sign means, and whether the structure can be run in reverse, is negative funding rates.
Fees, spread and borrow interest never appear on a funding leaderboard either, and they shave another layer off the small positive numbers above. Each one carries a measured figure in six hidden costs, taken from our own accounts.
The formula is one line. Everything that can go wrong sits outside it: the wrong price, the wrong split, the wrong instrument, a rebalance that never happened. Which is the question building it yourself has to answer.
Figures come from our own data snapshot dated 2026-08-25. Yearly and per-settlement values are summed, not compounded.