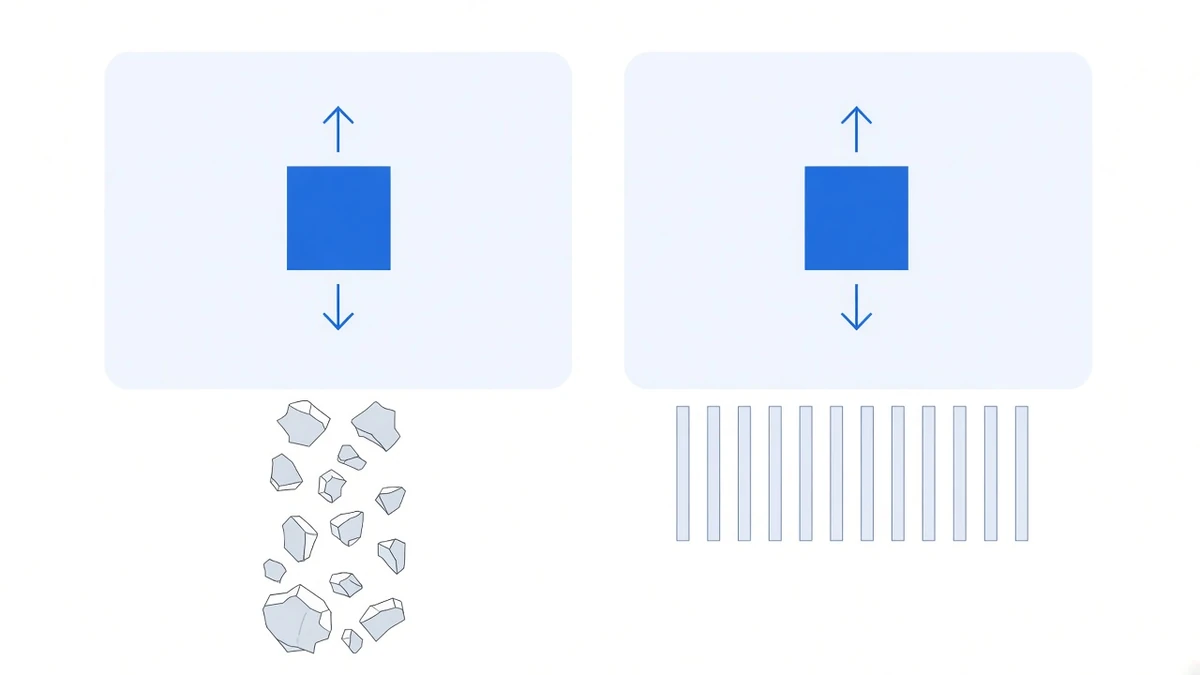
The thing most often skipped when comparing “delta neutral” products: neutral describes the price exposure, not the source of the yield.
Two things can both be delta neutral, both indifferent to whether the coin goes up or down, and still be completely different businesses. One is paid in tokens the protocol prints. The other is paid by perpetual longs, every eight hours, under a rule written into the contract. Different sources break in different ways and need different things watched.
Delta neutral explained covers the definition: first-order sensitivity to the underlying price is zero. This piece answers the next question — whose money are you actually collecting.
DeFi neutral farming: three income lines, three cost lines
The usual construction: provide liquidity in an AMM pool (say ETH/USDC), which leaves you long ETH by design, then short a matching size of perpetual to cancel that exposure. What is left is supposed to be “collecting fees and incentives, neutrally.”
Three income lines:
- Trading fees — the pool gets traded, you take your share.
- Incentive tokens — what the protocol prints to attract liquidity. Usually the bulk of the headline number.
- Funding — if the hedge leg happens to be short and funding happens to be positive, that leg collects too.
Three cost lines, and these rarely make it onto the marketing page:
- Impermanent loss. Price moves, the ratio of the two assets in the pool moves, and what you hold is no longer the two things you put in. It is not linear — the further price travels, the worse it gets.
- Rebalancing cost. The LP position’s delta drifts with price, so the hedge has to be adjusted. Adjust often and fees eat you; adjust rarely and exposure accumulates.
- The token price itself. You are not being paid in a stablecoin. You are paid in something you have to sell, and everyone else holding it wants to sell too.
Three properties that belong to this strategy alone
One: impermanent loss and the hedge are not the same problem. The perpetual short cancels the first-order term — “ETH went up or down.” Impermanent loss is second order; it comes from your holdings being rebalanced against you, and it only ever points one way. A clean first-order hedge does not make the second-order term disappear. This is the most common miscalculation in the category.
Two: the yield is denominated in the incentive token. Of a 40% headline, 35 points might be token. If that token halves while you hold it, those 35 points become 17.5 — and nothing about the quality of your hedge affects that.
Three: there is a whole face of on-chain risk. Contract bugs, oracle manipulation, a pool getting drained. None of these exist for a spot leg sitting on a centralised exchange. All of them are real here.
Funding rate arbitrage: one income line, written into the rules
By comparison, spot long plus perpetual short keeps a much shorter ledger:
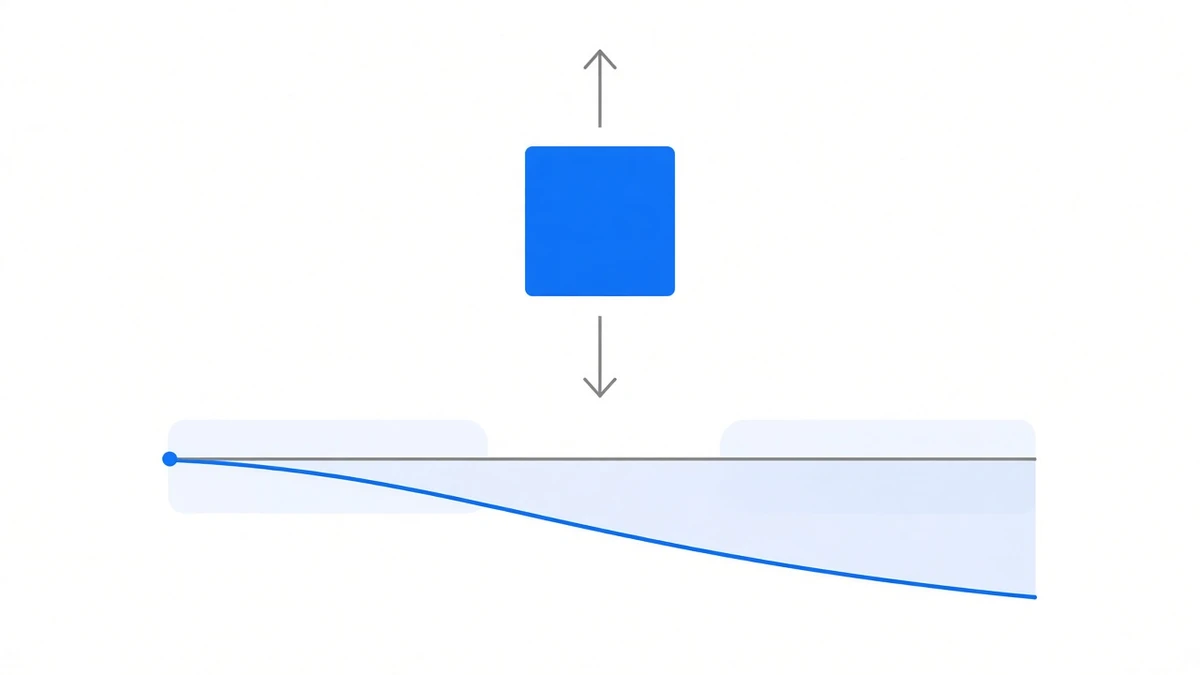
- One income line: funding. When the contract trades above spot, longs pay shorts each period. Nobody printed that money; one side of the market hands it to the other.
- Price moves cancel between the two legs, and there is no impermanent loss — you hold a fixed quantity of spot and a fixed notional short, so the ratio is never rebalanced against you.
- The settlement schedule is in the contract spec. Every eight hours, roughly a thousand periods a year, each one recorded.
The mechanism itself is in what is a funding rate. In this comparison, what matters is that it has exactly one failure mode: funding goes to zero, or turns negative. There is no second path.
And that one does happen.
Side by side
| DeFi neutral farming | Funding rate arbitrage | |
|---|---|---|
| Who pays | Protocol emissions plus trader fees | Perpetual longs, period by period |
| Denominated in | Mostly the incentive token | The quote currency (USDT) |
| Impermanent loss | Yes, and it is second order | None |
| Continuous rebalancing | Required, delta drifts with price | Only when notional drifts past a threshold |
| Main failure mode | Emissions cut, token falls, pool incident | Funding goes to zero or negative |
| Extra risk surface | Contract bugs, oracles, bridges | Exchange rules, margin, execution |
There is no “which is better” row. The risks are not on the same axis, so they do not rank. The one thing that does compare: when it fails, can you see it coming.
An emissions cut is in an announcement. A drained pool happens in one block. Funding drifting lower happens one period at a time, and you get a thousand of them to watch.
Our numbers, worst cell included
These come from our own period-by-period settlement records, as of 2026-08-25 13:42 UTC. Periods are summed, not compounded.
Across 2021–2025 — the five complete years where every settlement can be checked — the ten BTCUSDT and ETHUSDT cells average 12.43% raw per year, or 124.296% with capital scaled 10x.
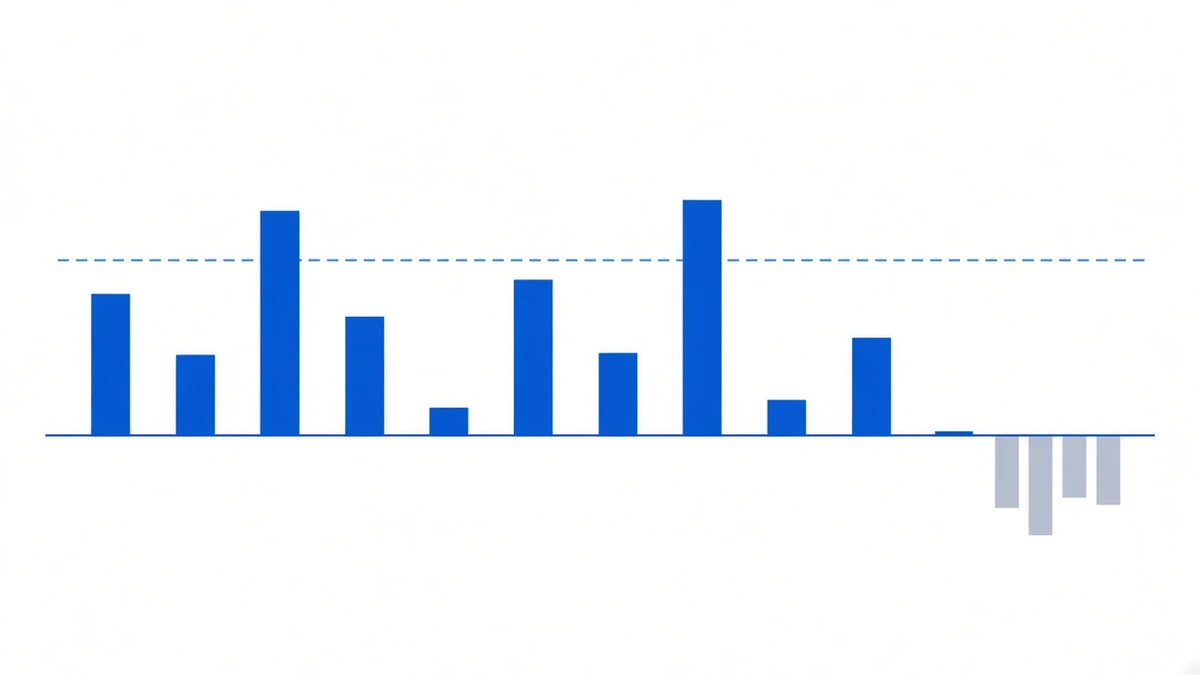
The ugliest cell in that table is ETHUSDT in 2022: 0.787256% for the entire year, 7.873% scaled. That is what “longs in no hurry, for twelve months” looks like. It sits next to 2021’s 37.562125% on the track record page, and we have not moved it.
One more number belongs here: SOLUSDT is negative year to date, −1.125987% (711 periods, about 237 days). BTCUSDT over the same snapshot is +1.589788%. Not every symbol, and not every year, is collecting.
Three questions that separate the two
When you see any number attached to the words “delta neutral,” ask these:
- How much of this yield is token? Recompute that part at the price you could actually sell into, not the quoted price.
- Has impermanent loss been deducted? Most displays show “fees plus incentives” without subtracting what the LP position lost relative to simply holding the two assets.
- Where does the rebalancing cost sit? Inside the net figure, or counted once against the gross?
The third gets glossed over most often, and it is exactly the line that separates a pretty number from a real one.
For how staking and lending sit against this, see same idea, different money. The wider line-up is on the yield comparison page.
And to finish the sentence properly: balancing two legs removes directional price risk, not all risk. Funding goes to zero and turns negative — 2022 is how that line got there. The perpetual leg still posts margin and can still be liquidated; who carries which risk goes through them one at a time. Good numbers this year do not imply good numbers next year.
Sources: our own figures come from the backend period-by-period funding snapshot, as of 2026-08-25 13:42 UTC, averaging only the complete years where every settlement can be checked. Past performance does not indicate future results. This is not investment advice.