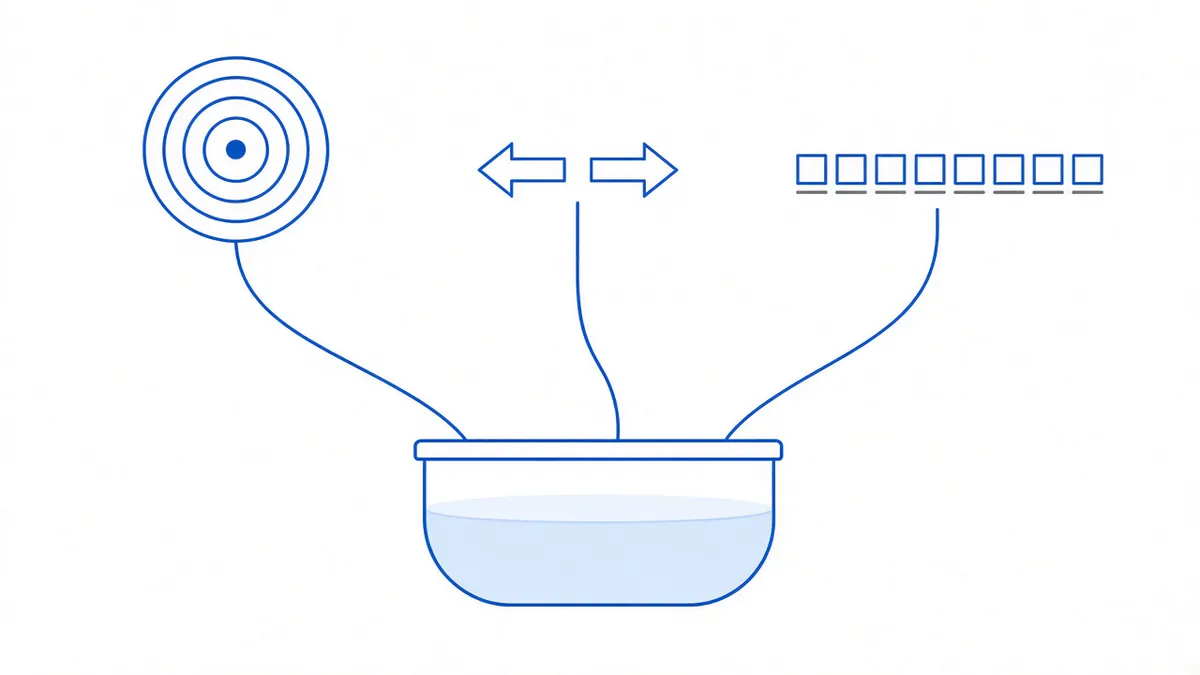
When comparing crypto yield products, the most useful question is not “what’s the APY”. It is: who pays this?
The rate is an outcome. The source is the nature of the thing. Three common products draw on completely different sources:
- Staking: paid by protocol issuance, which in substance is shared out among all holders.
- Lending and savings products: paid by the borrower’s interest, which depends on whether anyone wants to borrow right now and what they do with it.
- Funding rate arbitrage: paid by the longs on a perpetual contract, handed to the shorts at each settlement point.
Three sources mean three different failure modes. One at a time.
Staking: issuance pays, so it is denominated in the coin
Staking rewards are newly issued units, paid to whoever participates in validation. Nothing wrong with that, but two consequences follow.
First, it is denominated in the coin. 5% a year means you hold 5% more units, not that your purchasing power rose 5%. In a year the coin drops 30%, unit growth does not cover it and the account is smaller in fiat terms.
Second, all holders pay for it. Newly issued units dilute the holdings that did not stake. So the accurate reading of staking is “you get diluted if you don’t participate”, not “you earn extra if you do”.
Unbonding periods, slashing rules and validator reliability come attached, and they differ by chain. Out of scope here.
Lending: the borrower pays, so it moves with borrowing demand
Deposit the coin, the platform lends it out, and the interest the borrower pays minus the platform’s cut is your return.
The nature of that chain is: your return depends on someone at the other end borrowing, and on that someone repaying. In a bull market leverage demand is strong and rates are high; when the market cools, rates fall with it. And when everyone wants to redeem at once, the money is with the borrowers, not in the pool.
This is not an argument against such products. It is a statement that their risk is not price risk — it is counterparty and liquidity risk, which is a completely different category from staking.
Funding rate arbitrage: the longs pay, period by period
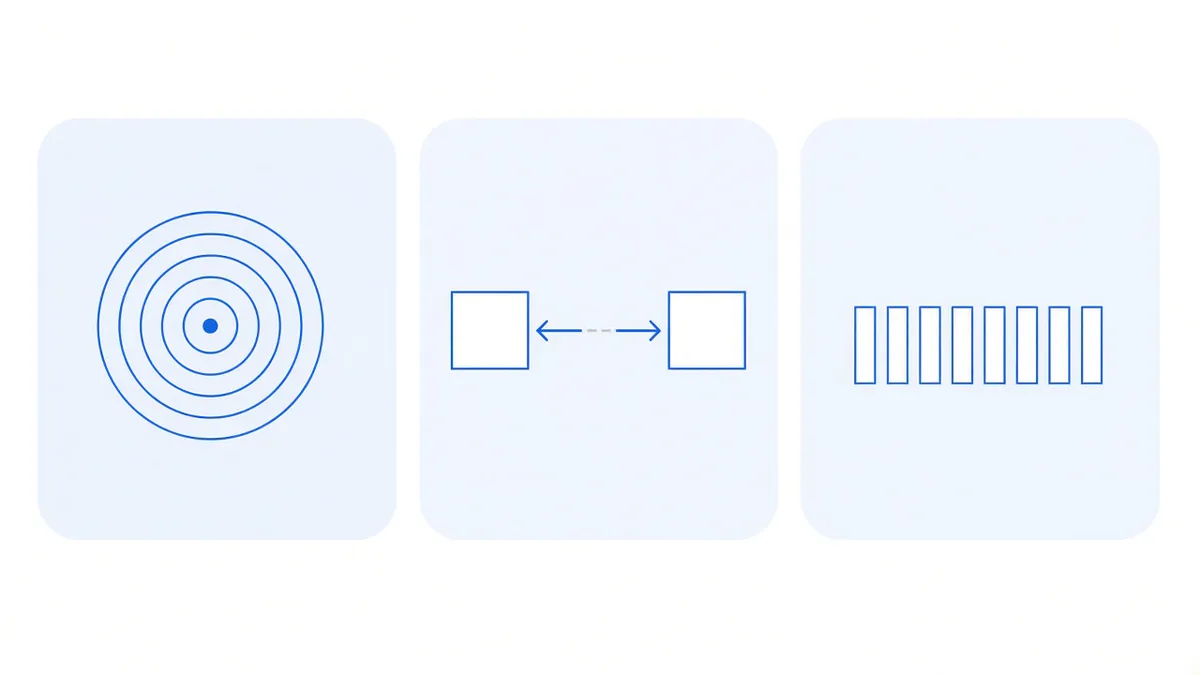
A perpetual contract has no settlement date, so funding is used to pull its price back toward spot. When the contract trades above spot, longs pay shorts each period; below spot, it reverses. This money is not created out of nothing and nobody issues it — one side of the market hands it to the other, with no third-party promise in between.
What a funding rate is covers the mechanism in full. For this comparison, three properties are enough:
One, it settles in the quote currency. Once the two legs are notionally balanced, the combination is insensitive to price moves, and the funding received is denominated in USDT. That is the sharpest divergence from staking: staking earns units of the coin, this earns quote currency.
Two, it happens period by period, and every period is on the record. Every eight hours, roughly 1,095 periods a year. How much each period paid and when it settled is kept — which is why we can put the year-by-year table out and let people reconcile it line by line.
Three, it goes to zero, and it turns negative. When longs are not in a hurry nobody pays; in flat and bear markets funding drifts toward zero. In stretches where the contract trades below spot, the direction of payment reverses (what a negative funding rate means). This is a condition the strategy will definitely meet, not an accident.
The three sources side by side
| Staking | Lending | Funding rate arbitrage | |
|---|---|---|---|
| Who pays | Protocol issuance, shared by all holders | The borrower’s interest | Longs on a perpetual |
| Denominated in | The coin | Usually the coin | Quote currency (USDT) |
| When it stops | Issuance rules change | Nobody borrows, or a borrower defaults | Funding hits zero or turns negative |
| Where the risk sits | Price, slashing, unbonding | Counterparty, liquidity, redemption runs | Funding level, exchange rules, execution |
| Can you audit it line by line | On-chain | Depends on platform disclosure | Period-by-period settlement records |
There is no “which is better” row, because these do not compete on one axis. The only thing genuinely comparable is: when it fails, can you see it coming.
Our own numbers, worst year included
An article about yield sources tends to quietly become a pitch in its last section, so this one just puts the numbers out, good and bad together.
The data comes from our own period-by-period settlement records, as of 2026-08-25 13:42 UTC, with periods summed rather than compounded (compounding assumes each payment is immediately added back to the position, and our position building is manual, with no auto-reinvestment).
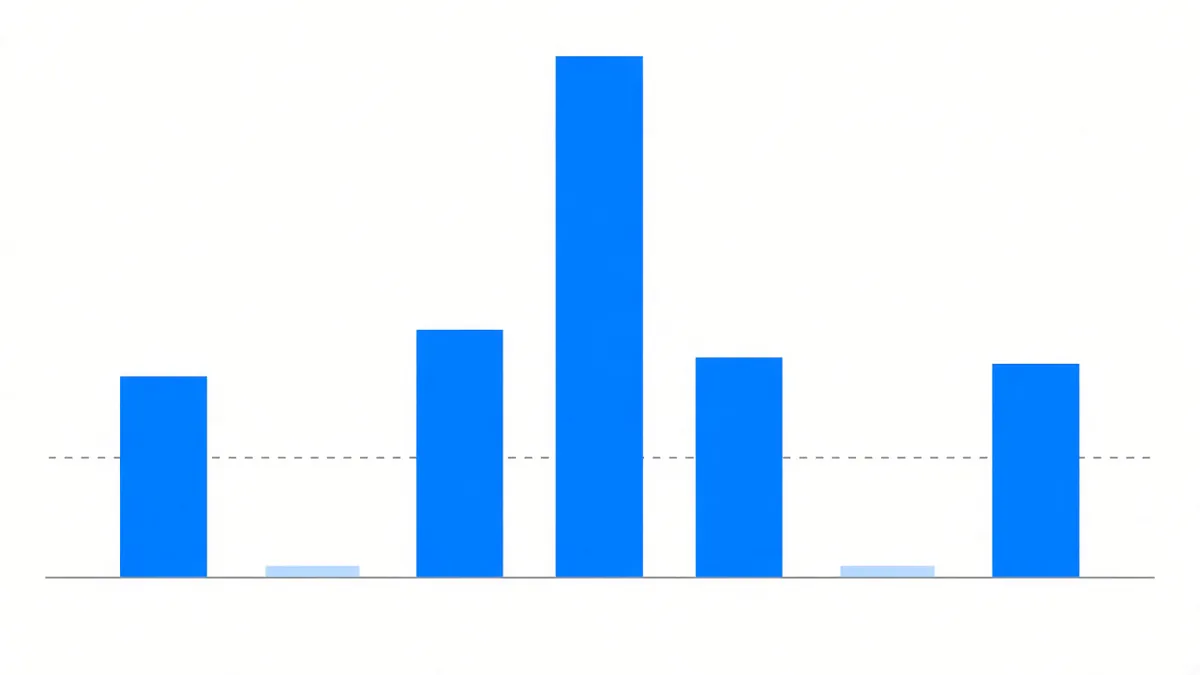
Taking only the five completed, fully auditable years from 2021 to 2025, BTC and ETH together averaged 12.43% a year in raw funding; with principal scaled ten times on an interest-free basis, 124.296%.
The worst cell in that same table is ETH in 2022: 0.787% of raw funding for the entire year, 7.873% after scaling. That year is what “longs are in no hurry for twelve months” looks like. We keep it next to the 2021 high on the performance page rather than somewhere else — six years of funding is written entirely about that one cell.
2026 had only 711 periods at the snapshot (roughly 237 days). It is not a completed year, so it appears in the table but enters no average.
Using “who pays” on any product
Once the question is out loud, a lot becomes easy to judge:
- The other side cannot answer, or only says “our strategy” and “diversified yield” — that is the answer.
- They can answer, but the source requires new money to keep working — treat this with particular care; the return should not come from later arrivals.
- They can answer, and you can reconcile the handover line by line — this is the case where it is worth reading the terms.
In that third case the next questions finally arrive: who custodies the money, where the fees come out of, what the worst year looked like. Four questions to settle before choosing a platform picks up from there. For a side-by-side of the yield categories themselves, the crypto yield comparison page is more complete.
To be clear as usual: funding rate arbitrage removes directional price risk, not all risk. Funding goes to zero and turns negative — the 2022 row is how that happens. Good data this time does not mean good data next year.
Sources: our own figures come from the backend period-by-period funding snapshot, as of 2026-08-25 13:42 UTC, with only completed, auditable years entering the average. Past data does not indicate future returns; nothing here is investment advice.