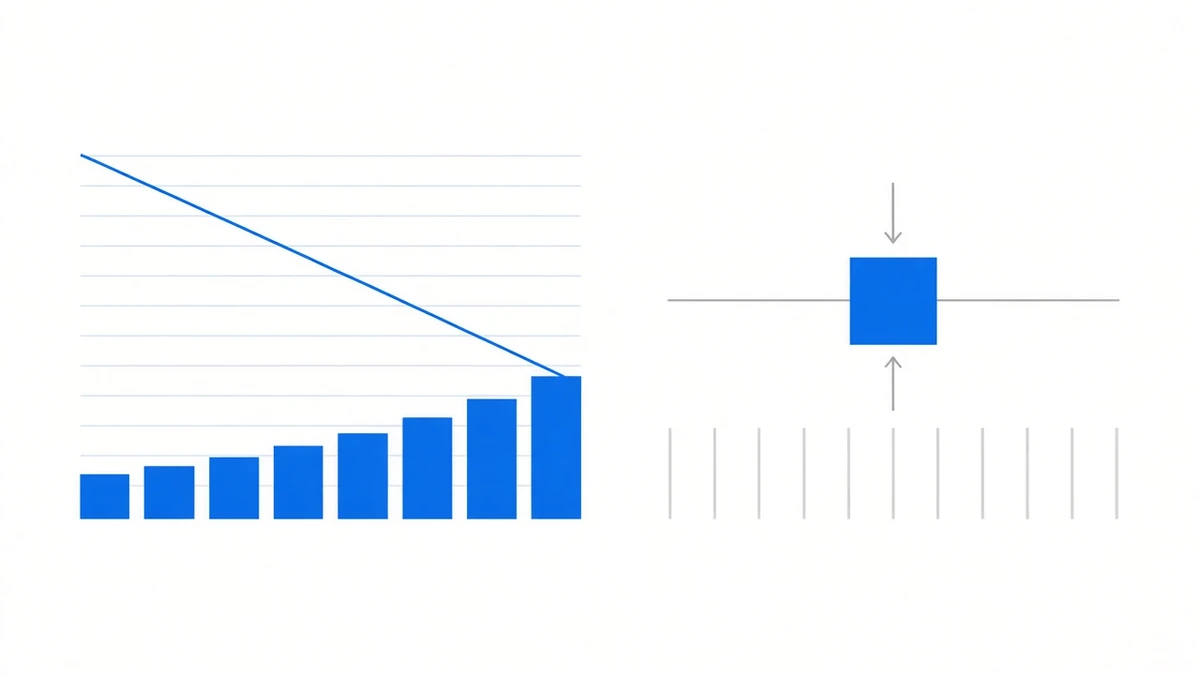
Grid trading and funding rate arbitrage often end up in the same drawer, labelled “the calm way to trade a sideways market.” Both do avoid betting on direction. That is where the similarity ends.
The biggest difference fits in one line: a grid buys when the price falls, and arbitrage never buys.
Halfway through a grid run you are holding coins. Halfway through an arbitrage position you are holding a long and an equal short. The first is net long; the second is flat. The moment the market stops going sideways, that one difference produces two completely different outcomes.
Where a grid’s money comes from: the movement itself
A grid places a ladder of buy and sell orders across a price range: buy a slice each step down, sell a slice each step up, harvesting the spread back and forth.
Where does the money come from? From the amplitude of the swings times how many times they repeat, minus fees. No counterparty pays you on a schedule. What you earn is the small gap between whoever sold to you and whoever bought from you.
That determines three real properties:
One: it adds to the position automatically on the way down. Not a bug, the design: one slice per step down. If the market keeps falling you keep buying, all the way to the bottom of the range. At that point you are fully invested, and your average cost is still above the current price.
Two: below the range the grid stops, the loss does not. The strategy no longer generates fills, but the coins you accumulated keep tracking the price. The small spreads collected earlier are usually covered over in one move.
Three: the advertised return is almost always a backtest. The range boundaries, the number of steps and the size per step are all chosen by you, and whether you chose well is only knowable after the fact. The same parameters across two different stretches of market can differ enormously.
None of this makes grids unusable. It makes them a directional strategy with a position, where only the entry schedule has been automated.
Where arbitrage money comes from: perpetual longs
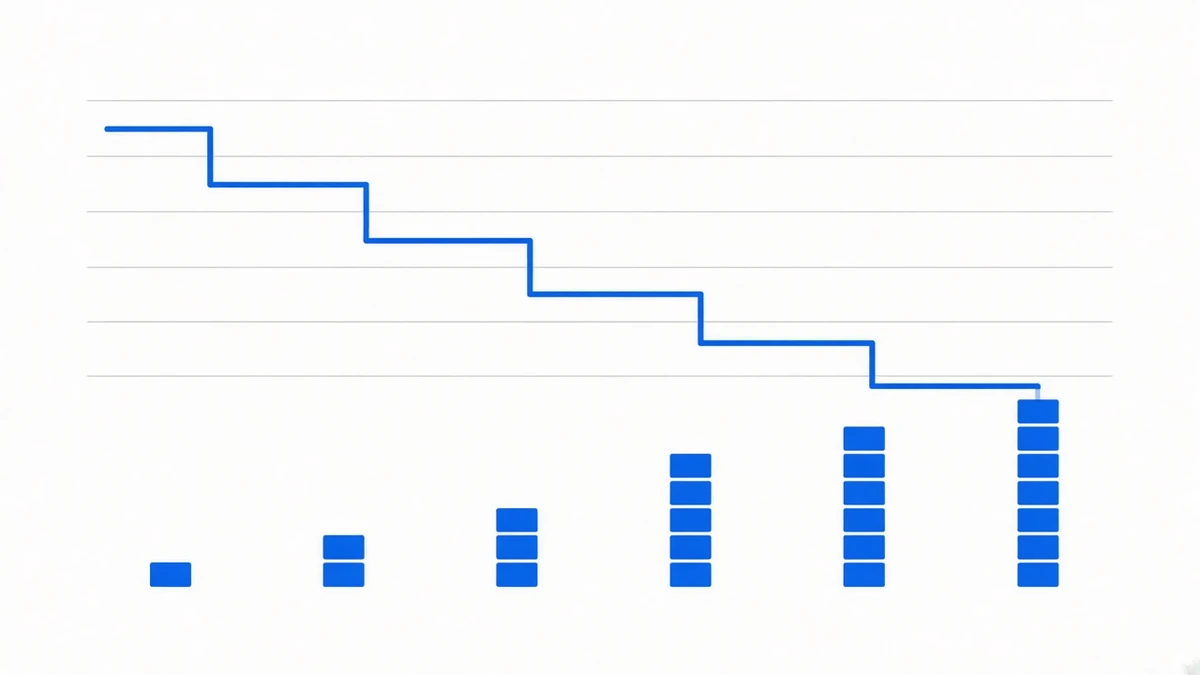
Spot long plus perpetual short, notionals matched. Wherever the price goes, the two legs cancel.
One income line: funding, every eight hours. When the contract trades above spot, longs pay shorts. That is a mechanism written into the contract spec; it does not need the price to cooperate. See what is a funding rate.
So it does not need a range. Straight up, straight down, flat — as long as funding is positive, that period collects. And conversely, even in a perfectly oscillating market, the periods where funding turns negative are periods you pay out.
Its risk is not in the shape of the market, it is in the level of funding. That is the fundamental difference.
Side by side
| Grid trading | Funding rate arbitrage | |
|---|---|---|
| Who pays | No specific payer; you earn the round-trip spread | Perpetual longs, period by period |
| Position direction | Net long, heavier the further it falls | Two legs matched, direction cancelled |
| What makes it work | Price oscillating inside a range | Funding being positive |
| Worst market | One-way break below the range | Funding at zero or negative for a long stretch |
| What happens then | Fully invested in coins, loss tracks price | Income near zero, principal does not track the coin |
| Where the return came from | Mostly a backtest, depends on parameters | Period-by-period settlements, checkable one at a time |
The second-to-last row is the point of the table. Both strategies have a worst case, but the worst case costs you different things. A grid loses principal through the position. A balanced two-leg position, when funding dries up, mostly loses income rather than principal tracking the coin down.
That sentence needs a limit on it: not tracking the coin is not the same as not losing. Periods where funding genuinely turns negative are paid out of pocket, the perpetual leg still posts margin and can still be liquidated, and the seconds when only one leg has filled are a real naked position. How bad does it get takes the losing stretches out and counts them separately.
What about “neutral grids”
A common variant runs the grid on perpetuals, or pairs a spot grid with a short. Worth unpacking.
A grid running on perpetuals is still directional — one long slice added per step down, still net long — except that now it can be liquidated. A spot grid that breaks below its range leaves you holding bags; a perpetual grid that breaks below its range can end the position entirely.
As for the version with a short attached, everything depends on whether the short notional moves in step with the grid’s position. The grid’s holdings change with every fill, so if the short is fixed, the structure is neutral only at the moment of entry and drifts on every subsequent step. Keeping it genuinely neutral means adjusting the short at every fill — and that fee is precisely the spread you just earned on that step.
The word “neutral” guarantees nothing on its own; it describes exposure at a moment. Delta neutral explained separates the definition from the common uses.
Our numbers, ugly cells included
From our own period-by-period settlement records, as of 2026-08-25 13:42 UTC. Periods are summed, not compounded.
Across 2021–2025, the five complete years where every settlement can be checked, the ten BTCUSDT and ETHUSDT cells average 12.43% raw, or 124.296% with capital scaled 10x.
The two ugliest cells have to be read together:
- ETHUSDT in 2022: 0.787256% for the year, 7.873% scaled.
- SOLUSDT year to date: −1.125987% (711 periods, about 237 days). BTCUSDT over the same snapshot is +1.589788%.
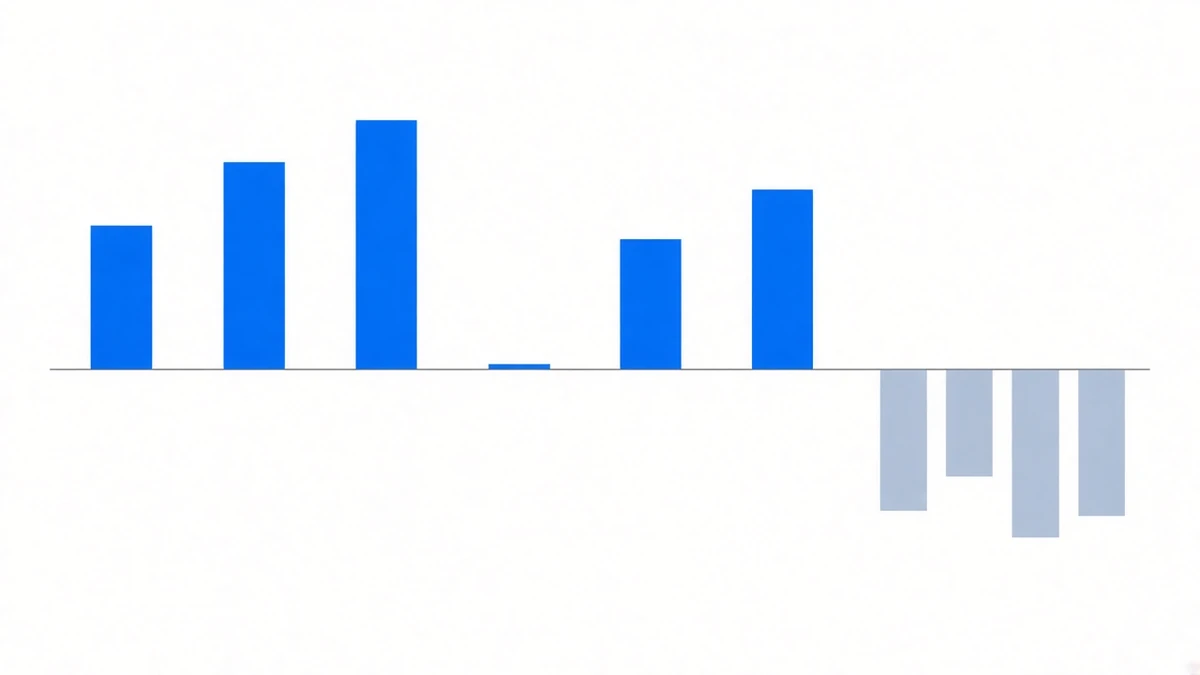
The second one is negative. Not every symbol, and not every year, is collecting — that is what the worst case looks like on this side. It does not arrive as a bag of coins you cannot sell; it arrives as income disappearing, or reversing.
How to tell which kind of “range strategy” you are looking at
Ignore the name and ask three questions:
- When the price falls, does it buy automatically? If yes, it is directional, whatever it is called.
- If the price never moves again from today, does it still earn? A grid does not (no fills). Funding arbitrage does, as long as funding is positive.
- Is the track record a backtest or a record of actual fills? Backtests can re-pick parameters. Settlement records cannot.
The second is the cleanest. A strategy that eats on volatility must earn exactly zero in a world where the price is frozen. A strategy that eats on a rule-based cash flow does not.
Finally
Neither is better; they fit different people. If you want to bet on a range oscillating and accept holding coins if it breaks, a grid is an honest tool. If you do not want to hold any direction and only want the payment that changes hands on a schedule, that is a different road.
The only thing genuinely worth avoiding is sizing a net long strategy as though it were neutral. That is not picking the wrong strategy, it is miscounting the risk.
Whether to build it yourself or have it run for you is a separate question; self-built versus managed puts the work involved on both sides in one place.
To finish the sentence properly: balancing two legs removes directional price risk, not all risk. Funding goes to zero and turns negative — 2022 and this year’s SOL are how those lines got there. Good numbers this year do not imply good numbers next year.
Sources: our own figures come from the backend period-by-period funding snapshot, as of 2026-08-25 13:42 UTC, averaging only the complete years where every settlement can be checked. Past performance does not indicate future results. This is not investment advice.