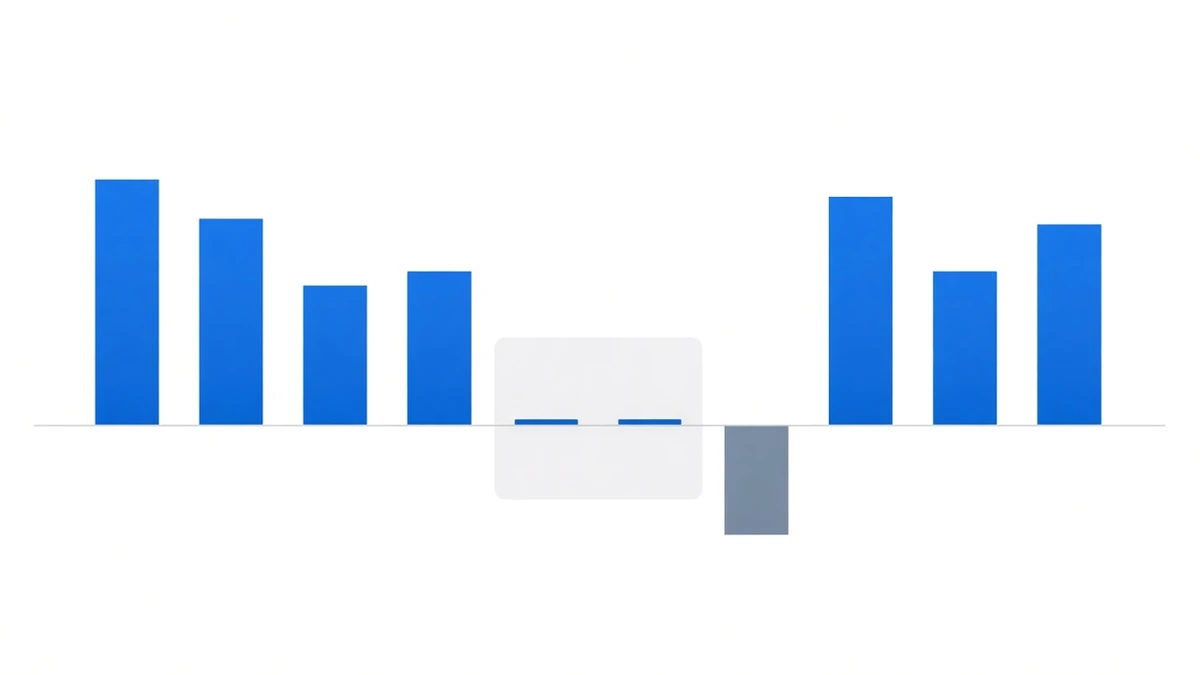
This one is not about the good side. Here are the worst stretches on their own — starting with a distinction most people collapse: there are three kinds of “bad” here, and they are not the same thing.
- The return gets too thin to bother — the common case, and this year’s case.
- Funding turns negative and you start paying — not rare; SOL this year.
- Execution or margin goes wrong and principal is actually gone — the only one that is a loss in the real sense.
The first two are return problems. The third is a principal problem. Blur them together and you reach one of two wrong conclusions: that this is dangerous, or that it cannot lose.
Kind one: thinner than a deposit account
Start with the yearly numbers. These are from our track record page, additive convention (periods summed, not compounded):
| Year | BTCUSDT | ETHUSDT |
|---|---|---|
| 2021 | 30.635% | 37.562% |
| 2022 | 4.165% | 0.787% |
| 2023 | 7.842% | 8.238% |
| 2024 | 11.980% | 13.019% |
| 2025 | 5.133% | 4.935% |
| 2026 (to date) | 2.030% | 1.209% |
ETHUSDT returned 0.787% for the whole of 2022. Not a month — 1,095 settlements summed across a full year. BTCUSDT managed only 4.165% in the same year.
This year is rhyming with it. From Binance’s public futures API (read at 2026-09-18 07:13 UTC, latest settlement 2026-09-18 00:00 UTC), 781 periods across 260 days:
- BTCUSDT cumulative 2.030026%, 2.85% annualised
- ETHUSDT cumulative 1.208608%, 1.70% annualised
Set that beside the fact that in the same week the Federal Reserve lifted the federal funds target range to 3.75%–4.00%.
Which means the gross return on this leg has trailed the short-term risk-free rate this year — before fees, spreads and rebalancing costs. Netting those out only makes it worse. The expenses that never show up on a screen are listed in six hidden costs.
This is the most common kind of bad, and it does not hurt. The account number still creeps upward, just slower than a savings account would. Because it does not hurt, people keep running a position that stopped being worth running.
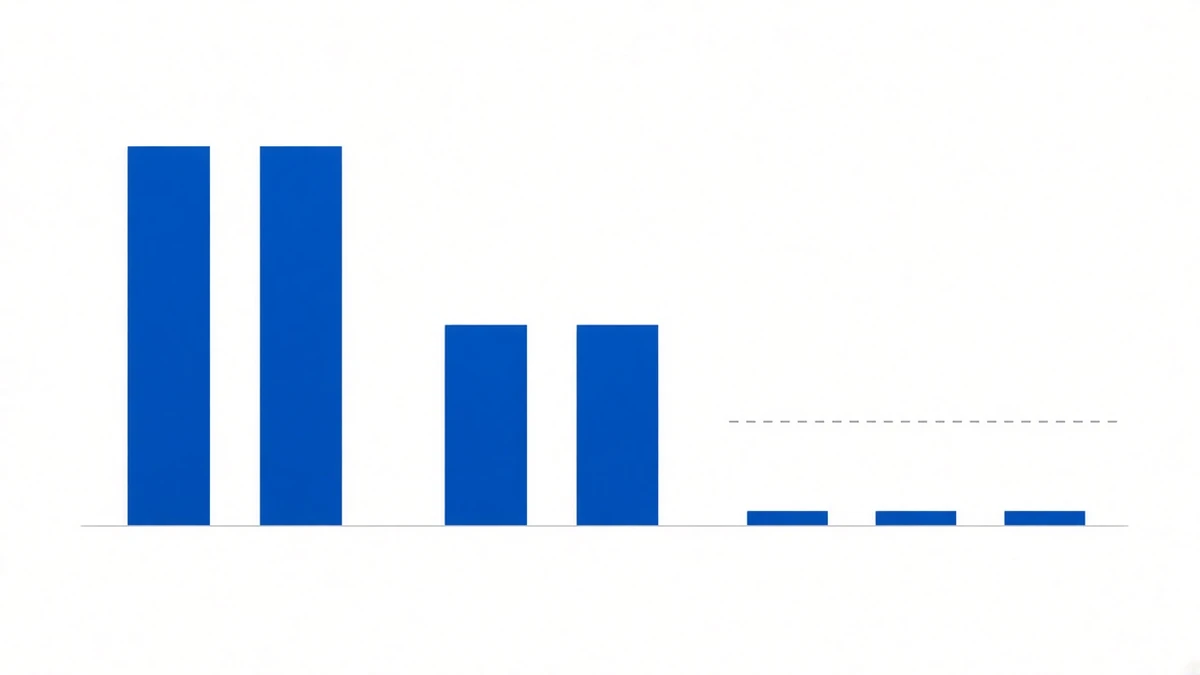
Kind two: negative, and you start paying
When funding is negative the relationship inverts: shorts pay longs. Your contract leg is the short, so you go from receiving to paying.
This year’s examples are right there in the table:
| Symbol | Year to date | Negative periods | Share of 781 |
|---|---|---|---|
| BTCUSDT | 2.030026% | 209 | 26.8% |
| ETHUSDT | 1.208608% | 247 | 31.6% |
| BNBUSDT | 2.001652% | 7 | 0.9% |
| SOLUSDT | −1.030962% | 390 | 49.9% |
SOLUSDT is negative this year. 390 of 781 periods sending money out, −1.030962% cumulative, −1.45% annualised. Anyone running this structure on SOL has been a net payer on funding in 2026.
The order in which symbols turn is the more useful detail. Across September’s 52 periods so far:
- BTCUSDT: 1 negative period, low of −0.00015%
- ETHUSDT: 8 negative periods, low of −0.01081%
- SOLUSDT: 22 negative periods, low of −0.008785%
Funding does not flip market-wide all at once. It seeps down from the more speculative symbols. For early warning, watch SOL and ETH, not just BTC. Whether you can run the trade in reverse is worked out in what negative funding means.
One point of fairness, though: the magnitude of the bleed is usually small. SOL’s net drag for the year is 1.03%, which averages to thousandths of a percent per period. It does not eat your principal. It wastes your year and costs you a little in fees.
Kind three: principal is actually gone
The first two are “earned less” or “bled slightly”. What can actually open a hole in principal is not the funding rate — it is the two legs failing to stay balanced.
Three typical ways:
- Only one leg fills. Spot bought and the short not on (or the reverse) leaves you holding a naked position for those seconds. A jump in that window can exceed a full year of funding income. Why “simultaneously” is the hardest part: what makes delta-neutral hard to run.
- The short leg gets liquidated. Balancing the legs cancels price direction, not margin risk. In a sharp rally the short’s unrealised loss is real while the spot leg’s unrealised gain cannot be posted directly as margin. Sizing is in sizing a delta-neutral position.
- The exchange delists the contract. The position is closed on the venue’s terms while your spot leg does not move — from that second on you are naked. Four venues using four different delisting conventions is something we covered separately.
What these three share: none of them appears in any funding table. Every historical series you can find silently assumes the two legs stayed balanced, and in practice they do not always. Who carries which risk is itemised in who carries which risk; the platform-side boundary is on our security page.
Why we avoid the word “drawdown”
Drawdown measures how far a net asset value has fallen from a peak. It assumes you have an NAV curve that rises and falls.
A balanced two-leg position earns only funding, and its curve is stepwise upward, occasionally flat, rarely drifting slightly down. It does not draw down the way a price chart does, so applying drawdown statistics to it produces a flattering number that means nothing.
Three more useful questions:
- What did the worst full year pay? (ETHUSDT 2022: 0.787%)
- What did the worst symbol cost this year? (SOLUSDT: −1.030962%)
- When the legs come apart, how much can one incident cost? (No historical average for this — the ceiling depends entirely on what price did in those seconds.)
The third has no tidy answer. That is also why we do not write the words “safe and reliable” anywhere on this site.
How to read all of this
Putting the numbers together, an honest description:
- Most years it produces a single-digit gross return; good years (2021, 2024) reach double digits.
- Bad years approach zero (ETH in 2022) and bad symbols go negative (SOL this year).
- Year to date, it is behind the short-term risk-free rate.
- Large principal losses do not come from the funding rate. They come from execution and margin.
Funding thinning toward zero or turning negative in flat and bear markets is something this approach genuinely runs into — the 2022 line on our track record page is exactly that, and we have not hidden it. Period-level rates and current readings are on our funding rate data page; read the worst cells first, then decide. For how the whole process runs, see how it works.
Sources: Binance public futures API (per-period funding history; read at 2026-09-18 07:13 UTC, latest settlement 2026-09-18 00:00 UTC); yearly totals on our track record page, on-site snapshot timestamp 2026-08-25 13:42 UTC; federal funds target range per the Federal Reserve FOMC statement of 16 September 2026.