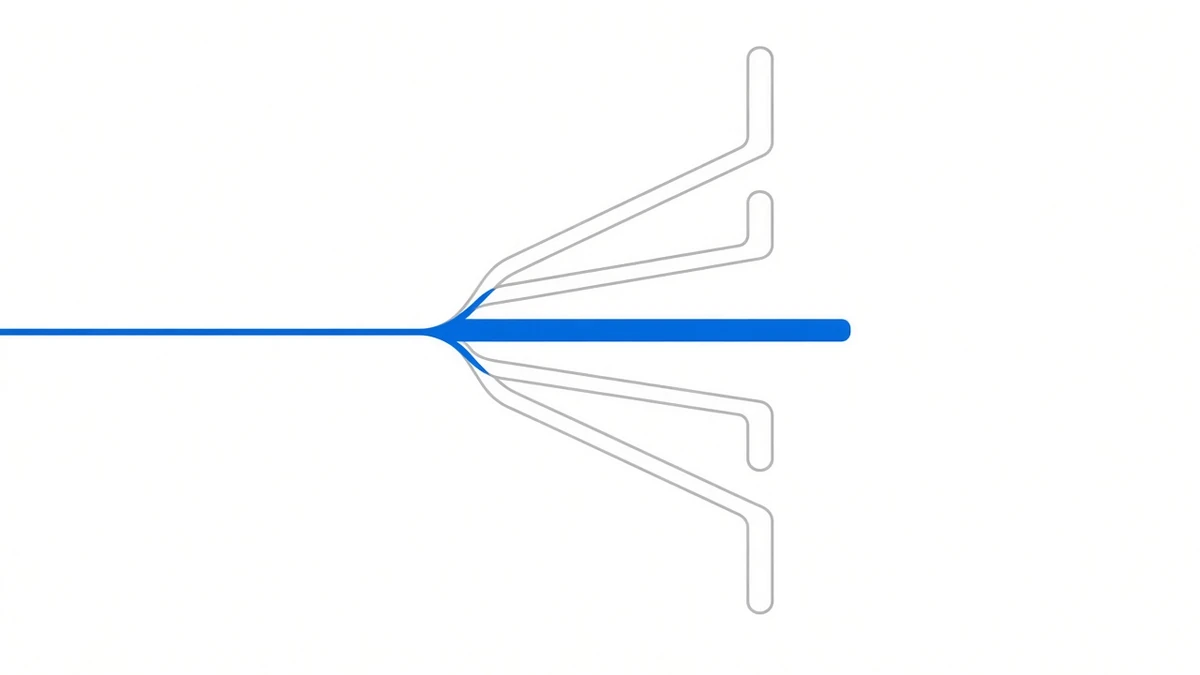
You see a return figure at month end and the first instinct is to extrapolate it. That is usually where it goes wrong, because part of that number is one-off and will not be there next month.
Splitting it takes five lines. Once split, you know which part repeats.
Why bother splitting
A funding-rate arbitrage return looks like it has a single source. It has at least five, and they behave completely differently: some recur every period, some only appear on the two days you open and close, one is always negative.
Reporting them combined as a single annualised figure is one of the more common ways an annualised number gets inflated. Not arithmetically wrong — just unstated methodology.
The five lines
1. The funding rate itself
The only line that recurs reliably. Each settlement moves cash in the direction the sign dictates.
There is a ready-made yardstick for this one. In our database, BTC perpetual funding summed to 0.456151% across all of September and 0.060452% over the seven days from 1 to 8 October; ETH on the same basis was 0.405997% in September and 0.079555% over the same seven days (snapshot as of 2026-10-08 06:00 +08:00).
Hold your own numbers against that: if your October return is materially above the 0.06% order of magnitude, the excess did not come from funding. It may well be a good thing — the spread went your way — but it will not show up every month.
2. Entry and exit spread between the legs
At the moment you open, the spot fill and the perpetual fill are not at identical prices; the same applies on the way out. The net of those two is a one-off gain or loss, and it can go either way.
It is routinely misread as skill. A favourable spread gets attributed to good execution, an adverse one to market conditions — when in reality it depends mostly on the order book in those few seconds and has nothing to do with how much funding accrued while holding.
3. Rebalancing friction
Once price has moved, the notional values of the two legs no longer match and the ratio has to be brought back. Each adjustment is a trade, and every trade carries fees and slippage. This line is always negative; the only question is by how much.
Rebalance often and you pay more friction for less drift; rebalance loosely and you get the reverse. There is no free setting in between.
4. Fees and rebates
Predictable, and routinely underestimated, because it accumulates per trade rather than per day held. The denser the settlement interval and the more frequent the rebalancing, the heavier it gets. The remaining costs in this family are in six hidden costs you cannot see on the screen.
5. The gap between mark price and traded price
Usually small enough to ignore. It becomes large in exactly two situations: liquidation, and the automatic settlement that accompanies a delisting. Both execute against the mark price rather than any price you could have traded.
The final hour before a delisting makes this especially visible — the insurance fund steps back, liquidation goes out as a single IOC order, and the remainder goes to auto-deleveraging. That spread belongs on line five, not on the funding line.
Doing this on your own book
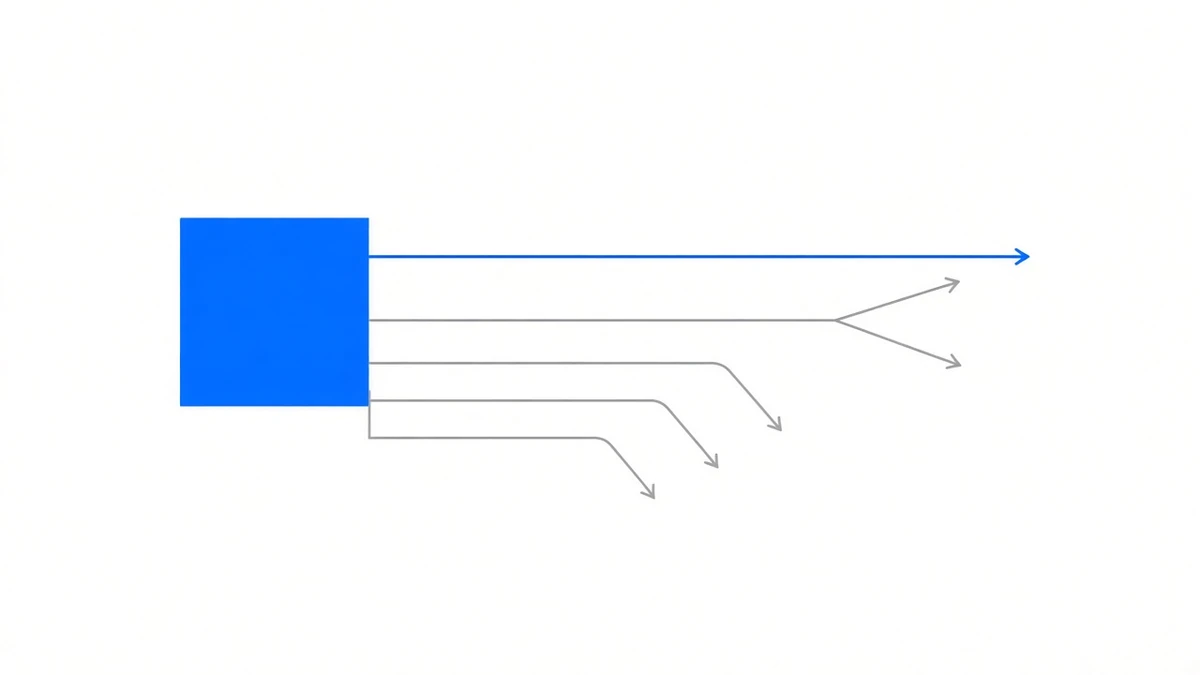
No special tooling required — four records, aligned:
- Funding payment ledger — the amount moved at each settlement, listed per period
- Trade detail — price, quantity and fee for every spot and futures fill
- Position snapshots — notional value of both legs at open, at each rebalance, and at close
- Account balance movement — the total, used to check the first three
The first three should sum to the fourth. If they do not, something is unaccounted for — usually the timing of a rebate credit, or a rebalance that was not logged.
On the platform side, these are precisely the records an investor can pull: balance, trade-by-trade detail, positions, the return curve, subscription records and withdrawal progress. Worth noting that the solvency ratio is not among them — that is an operator-side metric. What can and cannot be checked is set out in how to verify the returns a platform reports to you.
What to do with the split
Forecast off line one only. Do not forecast line two — it is random. Treat lines three and four as a fixed deduction at their historical average. Keep line five at zero normally and call it out separately in months where something happened.
This is also the question worth carrying into any performance table: how much of this number recurs. The yearly table on our performance page reports the funding line alone, summed period by period rather than compounded — the same dataset gives 79% summed and 120% compounded, and we publish the smaller one, because this system does not auto-reinvest and the compounded figure is not collectable.
One honest closing note: splitting the return cleanly does not stop the rate from turning negative. The 2022 row sits on the performance table either way. Attribution only tells you which line is doing the losing.