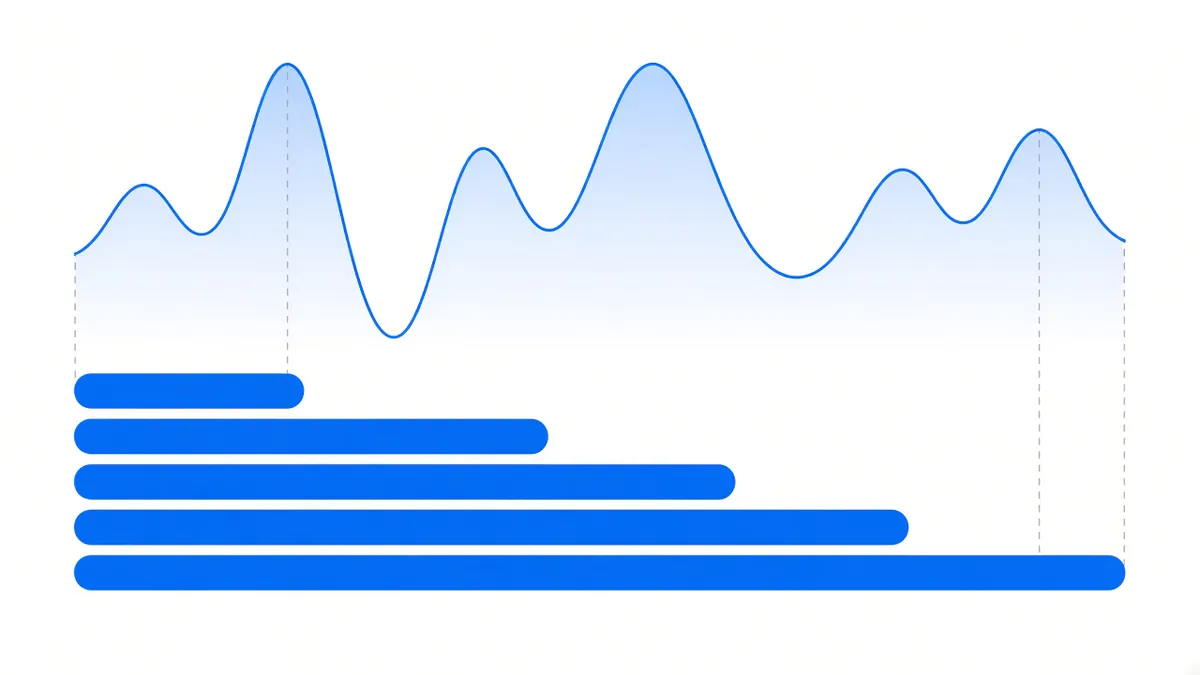
The answer first: the holding period does not decide what rate you get, it decides how many years you sample. Annual variation in this strategy spans an order of magnitude, so one year is more like a single draw and five years more like five draws summed.
Numbers first, conclusions after.
Year by year: adjacent years differ sevenfold
Annual totals from our backend period-by-period settlement data (raw funding, periods summed, not scaled), as of 2026-08-25 13:42 UTC:
| Year | BTCUSDT | ETHUSDT | Periods |
|---|---|---|---|
| 2026 | 1.589788% | 0.960325% | 711 (incomplete) |
| 2025 | 5.132678% | 4.935192% | 1095 |
| 2024 | 11.98048% | 13.01854% | 1098 |
| 2023 | 7.842115% | 8.237886% | 1095 |
| 2022 | 4.164925% | 0.787256% | 1095 |
| 2021 | 30.635167% | 37.562125% | 1095 |
| 2020 | 18.764618% | 31.581038% | unknown |
Two adjacent pairs make the point:
- 2021 to 2022: BTC fell from 30.635% to 4.165%; ETH fell from 37.562% to 0.787%. That ETH cell dropped more than fortyfold.
- 2024 to 2025: BTC fell from 11.980% to 5.133%, roughly halving.
The standard deviations say the same thing: 9.449693% for BTC, 13.758592% for ETH. The spread and the mean are the same order of magnitude — that is the single most important fact in this table.
Two easy miscalculations, stated plainly. The 2020 row has an unknown period count; it is a total carried over from the old dashboard and cannot be reconciled period by period. The 2026 row has only 711 periods (about 237 days at three per day) and is unfinished. Neither can be averaged together with completed years, which is why we set a hard line: years with fewer than 1,000 periods appear in the table but enter no average.
So what does holding for one year mean
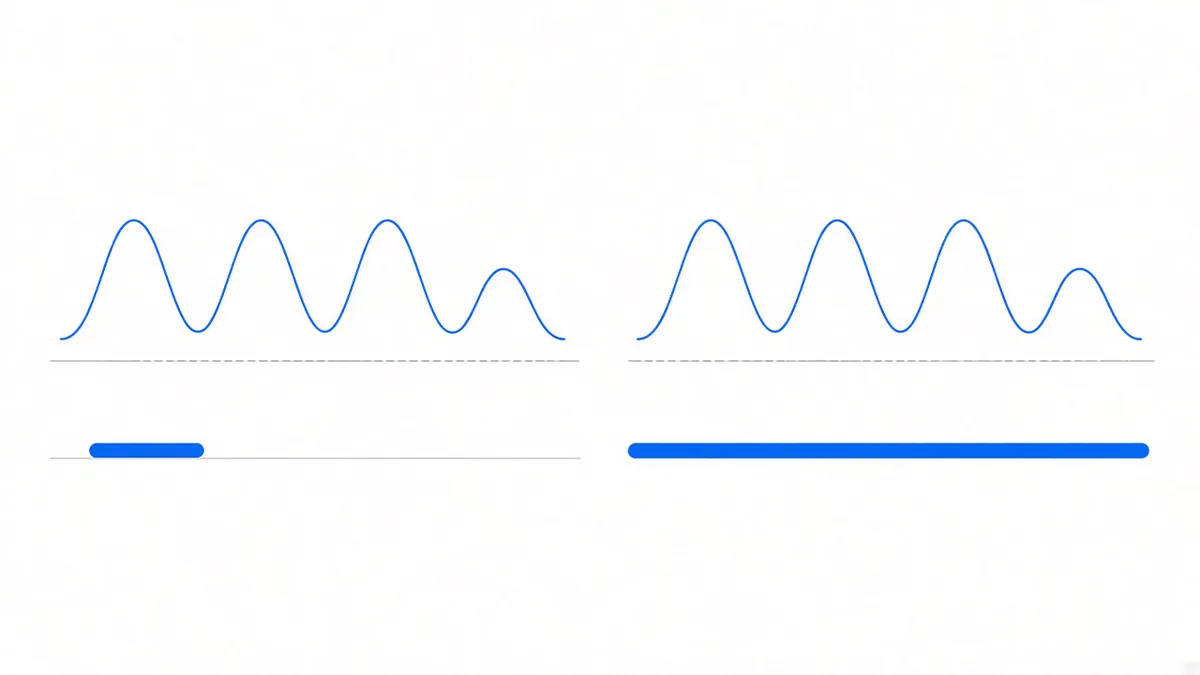
Suppose you invest for exactly one year. Your result depends entirely on which year that turns out to be:
- Catch a year like 2021 and raw funding is in the low thirties.
- Catch a year like 2022 and ETH is under one point.
Same strategy, same instrument, same execution process. The only difference is how impatient the longs were that year.
This is why a short holding period is, in practice, a bet on the market. It looks more flexible than a long one, but the price of that flexibility is handing the outcome to a variable you do not control.
Holding for several years is not “a higher return” either. It is each year’s extremes getting flattened a little by the other years. Across the five completed years from 2021 to 2025, BTC and ETH together averaged 12.43% a year in raw funding; with principal scaled ten times on an interest-free basis, 124.296%. Underneath that average sit both the 2021 high and the 2022 ETH low (7.873% after scaling).
An average is not a promise. It only tells you roughly where things converge once you have enough samples. Draw once and the average has nothing to do with you.
A longer term is not free
Having covered the upside, the cost. A longer term buys sample count and pays for it two ways:
One, the money is in there for longer. Over that time exchange rules can change, market structure can change, and the custodian’s credit standing can change. The longer the term, the more of this non-price uncertainty accumulates.
Two, you need to know how to get out first. This is the thing genuinely worth settling before signing, not on the day you want to leave.
Our terms run investment periods from 1 to 5 years, rising by tier, with amount tiers of 5,000–20,000, 20,000–100,000 and 100,000 and above. Amount tiers set entry size, term and service level; they do not set the split, which follows the plan. The capital-and-yield-protected plan states it explicitly: principal may be returned early, credited within 7 business days, with no penalty. Full terms per tier are on the pricing page.
Two things as always: the floor and the principal guarantee are honoured by the platform itself, so platform credit risk exists; on the unprotected plan both principal and return move with strategy performance and can lose money.
Do not let the market decide your entries and exits
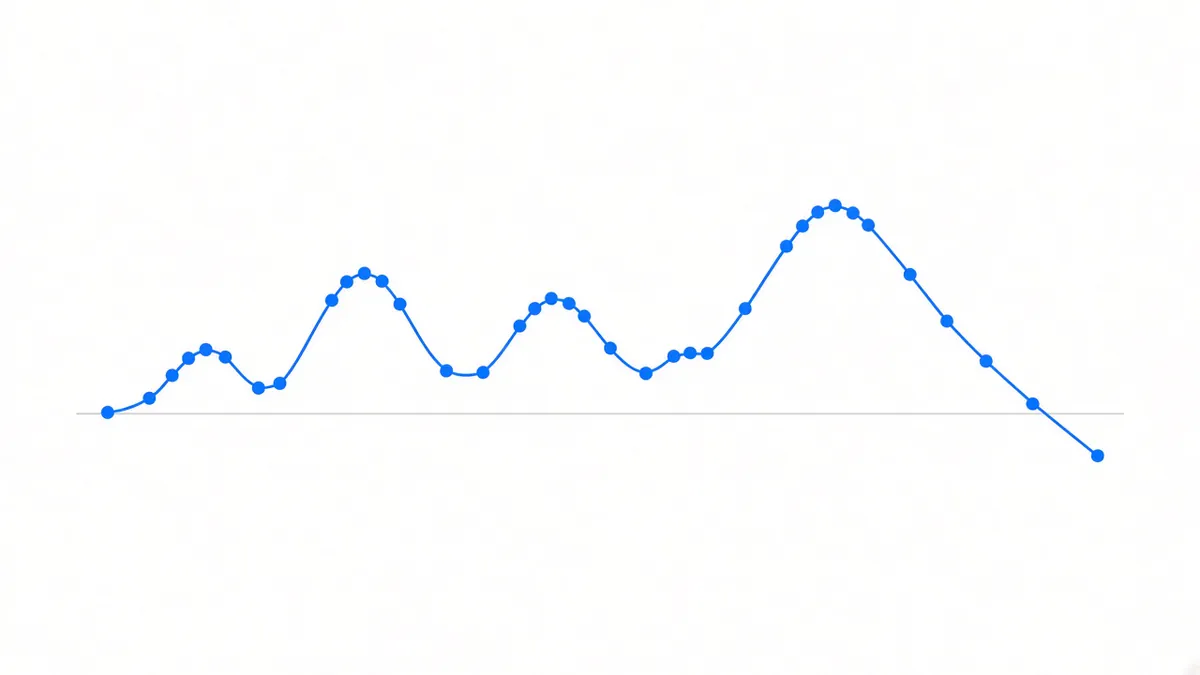
The most common approach is to enter when funding is high and leave when it thins out. It sounds reasonable. Three problems:
- The moment funding is highest is usually the moment sentiment is most crowded. The high print you are looking at is often the stretch just before it falls back.
- Each round trip is four commissions plus two rounds of slippage. Funding accrues one small period at a time.
- You systematically miss the recovery. The stretch where funding goes from thin to thick does not ring a bell, and you are outside the market when it happens.
One more basic misunderstanding to clear up: a falling price does not mean funding disappears. Funding is set by basis, not by direction — when the price crashes, does funding go with it uses the 29 August 2026 drop as a sample: the price fell nearly 6% over three days, and all 21 periods of funding stayed positive. Exiting early because of one drop means closing a position that was still collecting normally.
So how do you choose
No recommendations, just tests:
- Can you accept that the worst year looks like ETH in 2022? If not, that is not a term question, it is a question of whether this strategy suits you at all.
- Will you need this money in the next few years? If so, do not pick a long tier, however much better its sampling is.
- Have you actually read the terms for getting out early? Until you have, the length of the term should not be decided.
What the holding period really answers is a statistical question: how many chances you give the strategy. Give it one and the result is random. Give it five and the result drifts toward the average — but that average itself rests on five years of samples, and it is not a promise either.
For the year-by-year table with period counts and completeness markers, see the performance page; for what actually happened in the worst year, six years of funding is about that one cell.
In flat and bear markets funding drifts toward zero and can turn negative. That is a condition this strategy genuinely runs into; a longer term dilutes it but does not remove it.
Sources: annual totals, period counts and standard deviations come from the backend period-by-period funding snapshot, as of 2026-08-25 13:42 UTC, with periods summed; averages use only the five completed, auditable years from 2021 to 2025. Investment terms and early-exit conditions come from current product terms. Past data does not indicate future returns; nothing here is investment advice.