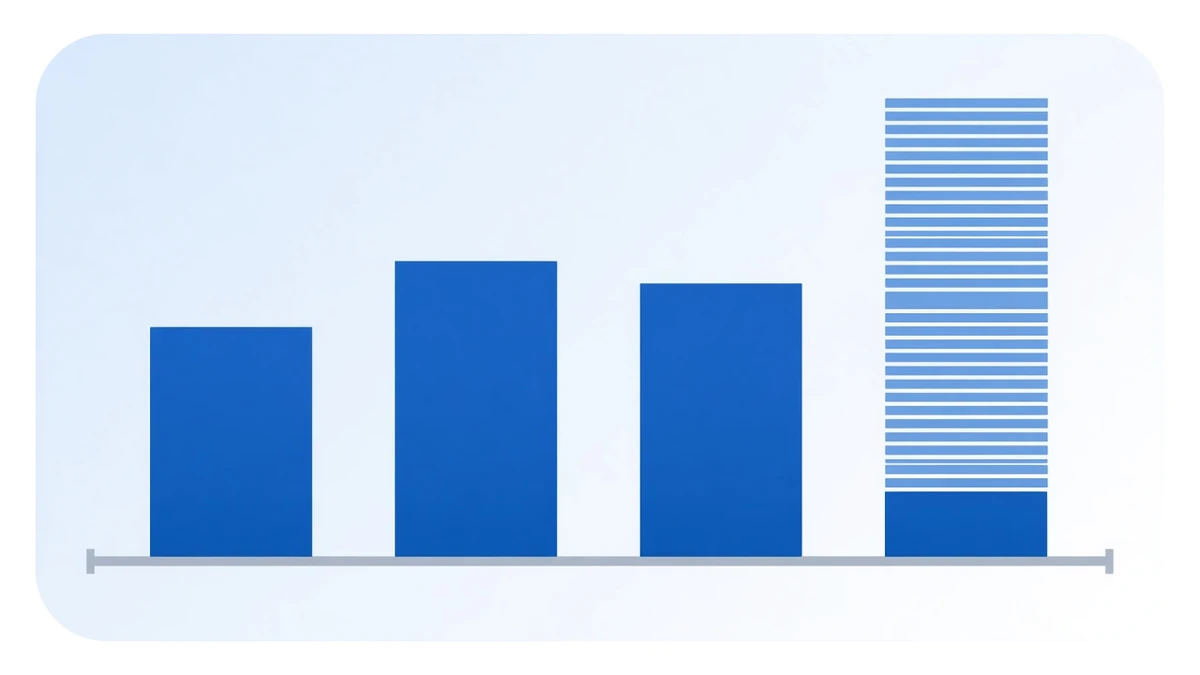
The conclusion first: funding readings from different exchanges cannot be compared directly. Before you compare them, ask one question — how often does this number settle?
The table below was pulled from four exchanges’ public APIs at the same moment (read at 2026-09-18 07:13:22 UTC; all four had their next settlement at 08:00 UTC).
| Exchange | Instrument | Current reading | Interval | Per day | Annualised |
|---|---|---|---|---|---|
| Bybit | BTCUSDT | 0.008101% | 8 hours | 0.024303% | 8.871% |
| Binance | BTCUSDT | 0.007384% | 8 hours | 0.022152% | 8.085% |
| OKX | BTC-USDT-SWAP | 0.005093% | 8 hours | 0.015280% | 5.577% |
| Hyperliquid | BTC | 0.001250% | 1 hour | 0.030000% | 10.950% |
Look at the last row. Hyperliquid shows the smallest reading of the four — about a sixth of Bybit’s — and the highest annualised figure of the four. It settles hourly, 24 periods a day; the other three settle every eight hours, three periods a day.
That is the first trap in comparing funding across venues, and it inverts the entire ranking.
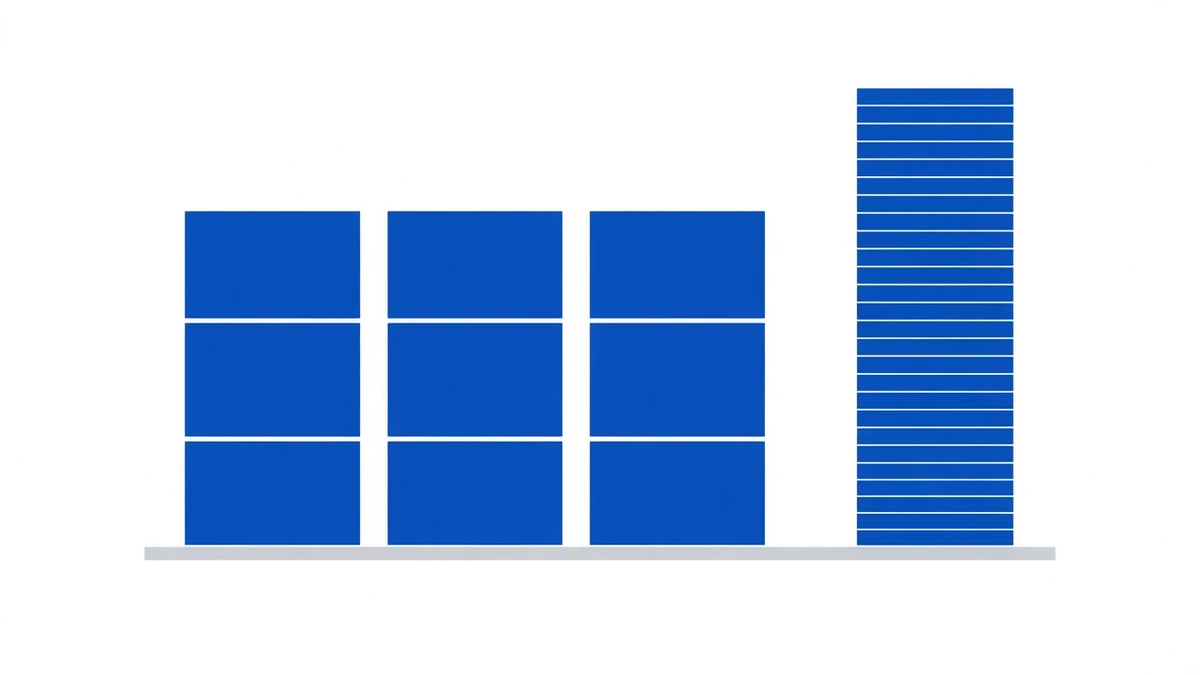
Trap one: different intervals mean different units
A funding rate is a per-period percentage, not an annual yield. The same 0.01% is 10.95% a year at eight-hour settlement, 21.9% at four hours, and 87.6% at hourly.
And intervals are not standardised — even different contracts on the same exchange differ. Binance moved a batch of contracts from eight hours to four this September, which we noted at the time.
So when you see a funding number: ask the interval first, the magnitude second. Plenty of aggregator tables put different venues in the same column without normalising.
One note on convention: the annualised column above assumes the current reading holds unchanged, which makes it a comparison figure, not an expected return. Rates change every period, and treating a single-moment reading as an annual yield is exactly the first error covered in what a funding rate calculator leaves out.
Trap two: a rate gap is not a return gap
Normalise for interval and the three eight-hour venues still differ: Bybit at 8.871% against OKX at 5.577% — 3.29 percentage points apart, same instant, same asset.
That looks like free money: short on Bybit collecting the higher rate, long on OKX paying the lower one, price risk hedged, pocket the spread. The logic is sound; four things get in the way.
- You need margin sitting at both venues. The same capital cannot collateralise both sides, so capital efficiency halves immediately.
- Liquidation is calculated separately at each venue. In a sharp one-way move, one side gains and the other loses — but the losing side hits its maintenance margin first. The gains on the other side cannot rescue it unless you can move money across in minutes.
- Moving money between exchanges is not instant. On-chain withdrawals need confirmations, and chains congest in volatile conditions. The moment you most need speed is the moment it is slowest.
- The gap itself disappears. The table is one snapshot. The two venues may converge by the next period, while the fees and spreads you paid to build both positions are permanent.
The fourth is the killer. The gap is transient; the entry cost is certain. You spend something definite to buy something that may not exist an hour from now.
Trap three: the same number describes different contracts
The four venues differ in quote conventions, mark price methodology, clamp limits and margin tiers. Two concrete examples:
- Clamp bands differ. The Binance contracts moved to four-hour settlement in September also had their caps reset to ±1.00%. The clamp decides how far the number can travel in extreme conditions.
- Interest components differ. Even inside Binance, BTCUSDT reports
0.00010000while BNBUSDT reports0.00000000— and the latter produced 423 periods of exactly zero across 781 this year. We expanded on that in why funding is usually positive.
So “which venue pays more” can have different answers at different time horizons, and the answer is frequently unstable.

So what is the table actually good for?
Not for finding arbitrage. For seeing how crowded each corner of the same market is.
That snapshot says leveraged longs on Hyperliquid were paying the most rent and longs on OKX the least. All four were positive, meaning longs were the paying side everywhere at that instant. If one venue alone flips negative while the other three stay positive, that is usually venue-specific — liquidity, delisting expectations, a large position unwinding — rather than a change in market direction.
A workable order of operations:
- Normalise to a common interval first, then compare magnitudes. Skip this and the conclusion can invert.
- Look at whether the direction agrees, not at how far the numbers are apart. All four aligned means it is a market signal; one outlier means it is a venue signal.
- For the level, read cumulative, not single-period. Single readings are extremely noisy. Binance BTCUSDT’s 781 periods this year total just 2.030026%, annualising to 2.85% — a far more honest number than any of the single-period figures above.
Worth stating plainly: that 2.85% looks worse than any 8% or 10% in the table, but it is what 781 actual settlements produced. A single-period annualisation is an assumption; a cumulative total is a fact. Period-level and yearly figures are all on our funding rate data and track record pages, including ETHUSDT’s 0.787% in 2022.
On choosing a venue or platform, we listed four questions worth settling first; on the execution difficulty of building positions across platforms, see what makes delta-neutral hard to run.
Sources: public APIs of four exchanges (Binance fapi premiumIndex, OKX public/funding-rate, Bybit v5 market/tickers, Hyperliquid info metaAndAssetCtxs; single combined pull, read at 2026-09-18 07:13:22 UTC); Binance per-period history from fapi fundingRate, latest settlement 2026-09-18 00:00 UTC; yearly totals on our track record page, on-site snapshot timestamp 2026-08-25 13:42 UTC.