
“How do I collect funding” carries a hidden assumption: that you can tell which periods are worth collecting.
But the rate on your screen belongs to the period that just settled. Open a position now and the money you receive comes from the next period, and that number does not exist yet. So the real question is whether the sign of the next period can be known in advance.
We built a model for exactly that, and we record every prediction alongside the value it later turned out to be. As of 22 September 2026 the table holds 12,124 predictions, 11,472 of them resolved, across 432 symbols.
The scorecard is below. One thing first: the headline number is useless.
Direction right 83.98% — and beaten by a zero-cost guess
Across the 11,472 resolved predictions, the predicted direction (negative / not negative) matched reality 83.98% of the time.
That number would be easy to market. But the same dataset contains another one: only 13.21% of periods actually came in negative.
Which means a rule requiring no model and no data at all — always guess “not negative” — would have scored 86.79%.
2.81 percentage points better than ours.
So accuracy is the wrong yardstick here. The reason is not subtle: negative funding is a minority event, and a constant model that always says “no” scores well by construction. Ours flagged 23.51% of periods as negative in order to catch that 13.21%, and the excess is precisely what it gives up on accuracy.
The question is not how many it got right. It is whether it can separate the two populations.
Split by band, and something appears
The model does not output yes or no; it outputs a probability. Bucketing the 11,472 by the probability it reported at the time, then counting how many in each bucket actually came in negative:
| Probability reported | Periods | Actually negative |
|---|---|---|
| 3.1% | 7,455 | 1.57% |
| 15.8% | 2,898 | 14.80% |
| 54.5% | 359 | 64.62% |
| 72.5% | 218 | 92.66% |
| 94.5% | 542 | 98.71% |
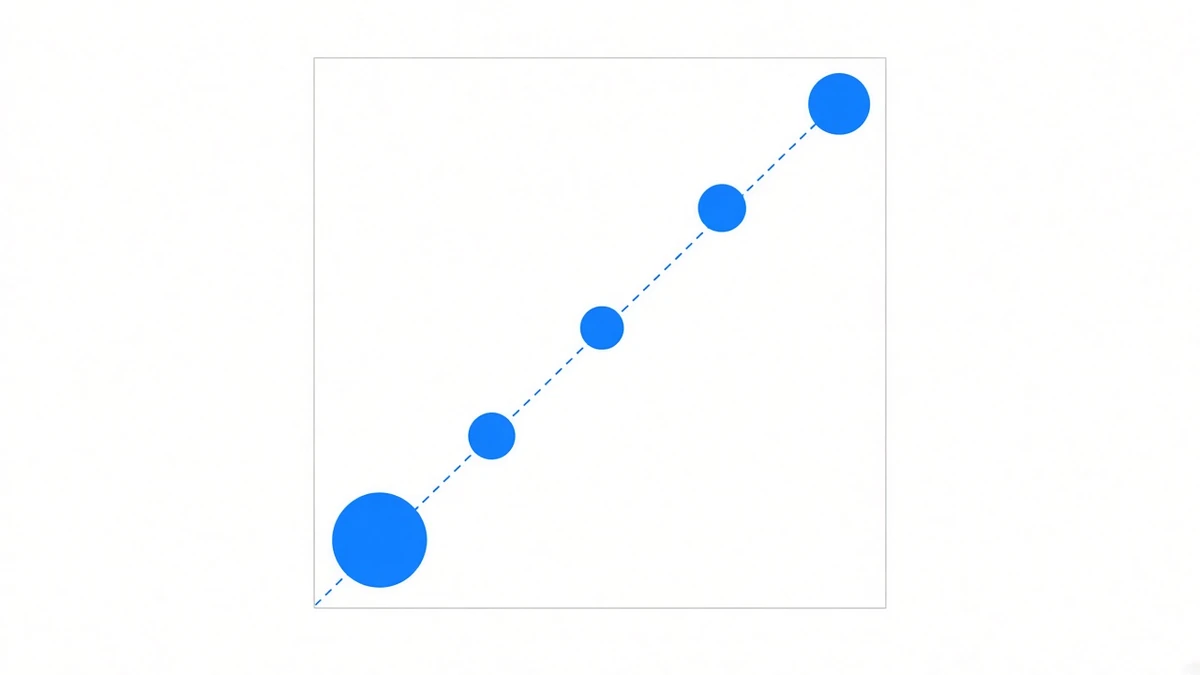
That table is the scorecard. Every row moves the same direction: the higher the reported probability, the higher the realised share of negatives, with no band out of order.
Collapsed into two piles it is starker:
- The 10,353 periods the model put below 50%: actually negative 5.3%
- The 1,119 periods it put above 50%: actually negative 86.6%
A factor of 16. That is where the value is — not in guessing correctly, but in splitting “barely worth worrying about” from “will probably hurt”.
One band where we under-report
Look again at the last two rows.
The 218 periods the model gave a 72.5% chance of going negative came in negative 92.66% of the time. The 542 it put at 94.5% came in at 98.71%.
Both bands are worse in reality than advertised. In other words, in the most dangerous bands the model is conservative — the risk it reports is smaller than the risk that materialises.
The low band runs the other way: 3.1% reported against 1.57% realised, which is over-warning.
That shape has a concrete consequence for use: when you see a moderately high warning value, do not treat it as an upper bound on the risk. And the middle band (54.5% reported, 64.62% realised) is a genuinely murky zone — 359 periods will not support a finer conclusion than that.
As for the magnitude rather than the sign: mean absolute error between predicted and actual is 0.0103% on a per-period basis. For scale, BTC’s mean period this year is 0.00268% — the error is four times the size of a major’s actual funding rate. So the model answers “will this go negative”, not “what will the next period be”. Using it to estimate a value is using it wrong.
Which makes the answer to “how do I collect funding”
Three things, most certain first.
Do not decide on the last period’s reading. The number on screen has already settled; it is not yours. And for majors that reading is usually pinned at 0.01% by the clamp formula anyway, carrying almost no information — the entry-timing piece counts that one out in full.
What is predictable is the tails, not the middle. In the table above the lowest and highest bands are very clean (1.57% and 98.71%); the middle is mush. The actionable part is both ends: the few hundred periods that are near-certain to go negative are worth avoiding, and the rest is not worth trading around.
Collecting requires surviving to the settlement instant. Funding is charged on a snapshot, not on time held; and whether your contract is on four hours, eight, or has been temporarily switched to hourly is covered in Binance funding settlement times. What to do when funding genuinely turns negative is in negative funding.
The limits of this scorecard
Two things that have to be said plainly.
The sample is one week. Those 11,472 resolved predictions cover settlement periods from 16 to 22 September 2026. The count looks large because it spans 432 symbols simultaneously; in time, it has seen one week of market conditions. Market structure within a single week is heavily correlated, so none of the percentages above should be read as a durable property. This is exactly why every prediction is written to the database in the first place: without that, “is it accurate” can only ever cite a backtest number, and a backtest number drifts with the market while nothing anywhere reports an error.
A prediction is written once, at the halfway point of the period. The same period gets scanned many times before it settles, and a later prediction has more information and is easier to get right. Scoring those would be marking our own homework, so the write happens at one fixed moment and is never revised.
In one line
The sign of the next period can be anticipated at the extremes and not in the middle; the magnitude cannot be estimated at all, since the model’s error exceeds a major’s funding rate outright.
Which is also why the returns in this strategy come from staying in and accumulating periods rather than from picking the good ones. The year-by-year record is in performance, worst years on the same table; how the two legs are run is in how it works.
Data: predictions and outcomes from our own funding forecast table — 12,124 predictions, 11,472 with actual values backfilled, covering predicted settlement periods from 2026-09-16 to 2026-09-22 across 432 symbols. Direction is scored as matching sign (both negative or both non-negative); unresolved rows are excluded entirely. Bands are the calibrated probability the model output at prediction time, and the figures shown are each band’s actual value. Mean absolute error is per period. BTC’s mean period comes from the per-settlement database, 2026-01-01 to 2026-09-22 03:00 UTC (793 periods). Yearly cumulative figures are in performance, site snapshot 2026-08-25 13:42 UTC. Model output is not investment advice, and past performance does not indicate future results.