
This question has to be split in two.
First: is the strategy itself a scam? No. You can name who pays the money, and you can go and check it yourself right now.
Second: is the person selling you “funding rate arbitrage” a fraud? That one is case by case, and plenty of them are.
Roll the two questions into one and you will make both mistakes: trusting anyone who uses the term because the mechanism is real, or dismissing the mechanism because you once met a fraud.
The strategy side: the money has a name
A perpetual contract has no expiry, so the only thing pulling it back toward spot is a payment collected every 8 hours. When funding is positive, longs pay shorts. Hold spot and an equal short at the same time and that payment is what you collect.
So the other side of the trade is specific: the people who opened leveraged longs. Not “the market,” not “an algorithm,” and not later investors.
You can verify that on the spot. Binance’s period-by-period funding is a public endpoint anyone can pull. We pulled all 788 of this year’s periods at 2026-09-20 14:11 UTC:
| Symbol | Year to date | Positive periods | Negative periods |
|---|---|---|---|
| BTCUSDT | +2.091425% | 579 | 209 |
| ETHUSDT | +1.265904% | 541 | 247 |
| BNBUSDT | +2.059435% | 358 | 7 |
| SOLUSDT | −0.960962% | 398 | 390 |
The convincing thing in that table is not the positive numbers. It is the negative one.
SOLUSDT is cumulatively negative this year, paying money out on 390 of 788 periods. A real mechanism that depends on an outside market for its income must have stretches where it is not paid. Conversely, an “arbitrage return” that never goes negative is not getting its money from here.
The seller side: six hard signals
Each one below comes with the corresponding real mechanism, because “be wary of high returns” gives you nothing to test against.
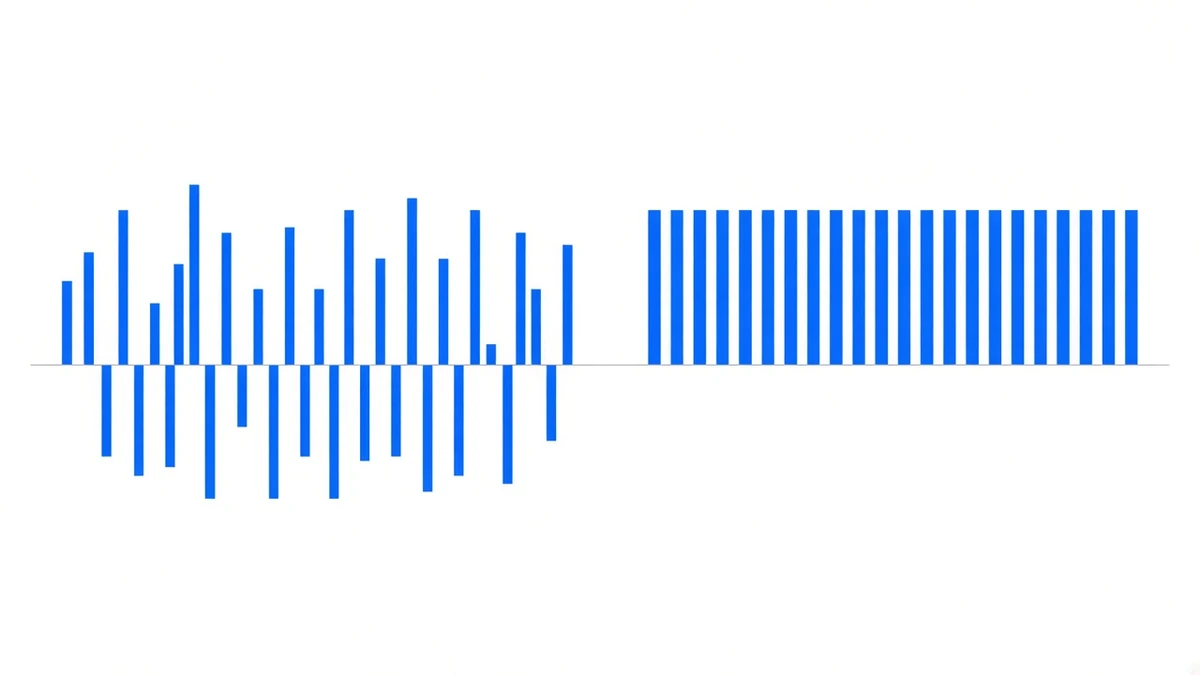
One: a fixed daily return. “1% a day”, “0.5% settled daily”. Real single-period funding is on the order of 0.01%, and the largest single period across this year’s 788 was exactly 0.010000%, never once above it. Three full periods in a day comes to 0.03%.
Two: returns claimed to be completely independent of the market. Balancing the two legs does remove the effect of price direction, but it does not remove the dependence on demand for leverage. When the market is quiet and nobody is opening leveraged longs, the income is thin. “Up or down does not matter” is true; “steady returns in any market” is not.
Three: a cumulative curve and nothing period by period. This mechanism’s data is natively period-level — one number every 8 hours. Being unable to produce the period detail means the strategy is not being run behind the scenes.
Four: recruitment with tiered commissions. Arbitrage income comes from an outside market; an additional customer does not raise funding, and may well make things worse through the capacity walls. When recruitment sits at the centre of the return structure, the revenue source is not the market.
Five: no answer on whose account holds the money. The easiest question to ask and the easiest to have fudged. Account ownership determines what class of creditor you are if something goes wrong, which is worked through in the counterparty risk piece.
Six: “zero risk” or “guaranteed high yield” as the headline. Balancing the legs removes one of four risk categories; the other three remain, and a managed arrangement adds a fifth. Who bears which of the four goes through them one at a time.
The subtler class: true numbers, skewed framing
The six above are relatively easy to spot. This class is not: every figure traces back to something real, and assembled together they produce an illusion.
Compounding passed off as adding. The same settlement series comes to 80.109771% added across seven years and 108.44294% compounded. We tripped over this ourselves: an earlier version of the main site carried the old dashboard’s compounded value and reported 2021 as 35.83%, where adding the same data gives 30.635167%. Where the two conventions differ has a piece of its own.
Cherry-picked years. BTC paid 30.635167% in 2021; ETH paid 0.787256% in 2022. Showing only the first is not strictly a lie, but it draws something highly volatile as a straight line.
Gross passed off as net. Between the gross rate and money in hand sit four costs, the management fee and the profit split — across those five steps, the three plans end up far apart.
One interval passed off as another. The same 0.01% settled every 8 hours versus every 4 hours annualises to twice the figure. Binance moved 18 TradFi perpetuals to 4-hour settlement this year in two batches — a parameter capable of putting your annualised figure out by a factor of two.
Turning the knife on ourselves
Standards that cannot be applied to us are marketing. Point by point:
Verifiable, directly on the investor side: balance, per-trade records, positions, the return curve, subscription records, withdrawal progress.
Not verifiable: the platform’s overall solvency ratio. It sits behind admin permissions and investors cannot pull it. Some places describe it as investor-visible; that is wrong, and we are saying so here.
A real failure state that exists: the position state machine has an actual Defaulted state. A system that were genuinely risk-free would not need that state in its code.
Where the terms stop: across all three plans funds are held in a dedicated platform account, with a flat 2% annual management fee deducted from returns. Plans one and two include a 100% principal guarantee; plan three does not. Managed custody is not principal protection; the principal guarantee and the yield floor are performed by the platform itself, so they carry platform credit risk. Terms are governed by the plans page, and the risk framing is on security and risk.
Which also means: what we can demonstrate is that the strategy is real, the data checks out and the risks are disclosed. What we cannot demonstrate is that nothing will ever go wrong here. No counterparty can demonstrate that second one.
Five checks you can run yourself
- Go and pull the public endpoint. Binance’s period-by-period funding needs no API key. If their reported numbers do not match the endpoint, you are done.
- Ask which year was the worst, and by how much. Not being able to answer, or changing the subject, tells you more than any return figure.
- Ask about conventions: added or compounded, gross or net. Two questions, four combinations, and only one of them corresponds to the number that shows up in your bank account.
- Run a small withdrawal end to end. Time it from request to funds landed. That number is harder than any safety marketing.
- See whether they will write down the risks. A seller willing to spell out liquidation, delisting, counterparty exposure and negative funding at least demonstrates they know what they are selling.
The one-sentence answer
Funding rate arbitrage is a real mechanism that can be checked period by period against public data, and the strongest evidence that it is real is that it sometimes does not pay — SOL’s negative sign this year, ETH’s 0.787256% in 2022, and BTC annualising to just 2.910% this year, below the risk-free rate over the same stretch.
Scams do not show you those numbers. Their curves are always straight.
Sources: this year’s 788 settlement periods, the positive and negative period counts and the single-period maximum come from Binance’s public USDT-margined futures endpoints (read 2026-09-20 14:11 UTC, covering 2026-01-01 through 09-20 08:00 UTC); yearly totals on both the added and compounded conventions come from the back-office settlement snapshot (as of 2026-08-25 13:42 UTC) and are shown on the track record page; plan terms per the plans page, risk framing on security and risk. Past performance does not indicate future results, and this is not investment advice.